For any system to work effectively, accurate data representation is crucial and the same is the case with Geographic Information Systems (GIS). In GIS, the available data plays a vital role in helping analyse spatial relationships, modelling geographical features and more. This data also helps in making informed decisions in the context of urban planning, environmental management, agriculture, etc. Allow us to mention that vector data is one of the most fundamental types of vector data in GIS, offering structure and precision unmatched by raster formats.
In today’s blog, we aim to explore what vector data is, its different geometries and its applications across GIS. We urge you guys to read the blog till the end to equip yourselves with essential information on vector data in GIS.
Need High-Precision Spatial Data for Your Projects?
Vector GIS data ensures accuracy and efficiency in mapping and analysis.
📞 Schedule a Call | 📩 Email Us | 💼 Get a Quote Now
What is Vector Data?
There are two types of primary data in GIS; raster data and vector data. In this part of the blog, we will briefly explain the difference between raster data and vector data.
| TYPES OF DATA IN GEOGRAPHIC INFORMATION SYSTEMS (GIS) | |
| RASTER DATA | VECTOR DATA |
| The data is represented as a grid of cells or pixels, each with a specific value. | The data is represented in the form of points, lines and polygons. |
| The data structure is composed of cells in a matrix format (rows & columns). | The structure of data is composed of geometric shapes (coordinates and vertices). |
| The storage requirements of raster data are larger in size due to high-resolution grids. | The storage requirements of vector data are smaller in size; depending on the complexity of shapes. |
| Raster data is generally less precise as the accuracy depends on resolution. | Vector data is more precise and accurate as it uses exact coordinates. |
| Raster data is often used for surface modeling and image data. | Vector data is used to map roads, rivers, etc. |
| Common formats of raster data are TIFF, JPEG, PNG, etc. | Common formats of vector data are SHP, GeoJSON, KML, etc. |
A clear understanding of raster and vector data in GIS is essential to determine which data model suits a specific application discrete mapping or continuous surface representation.
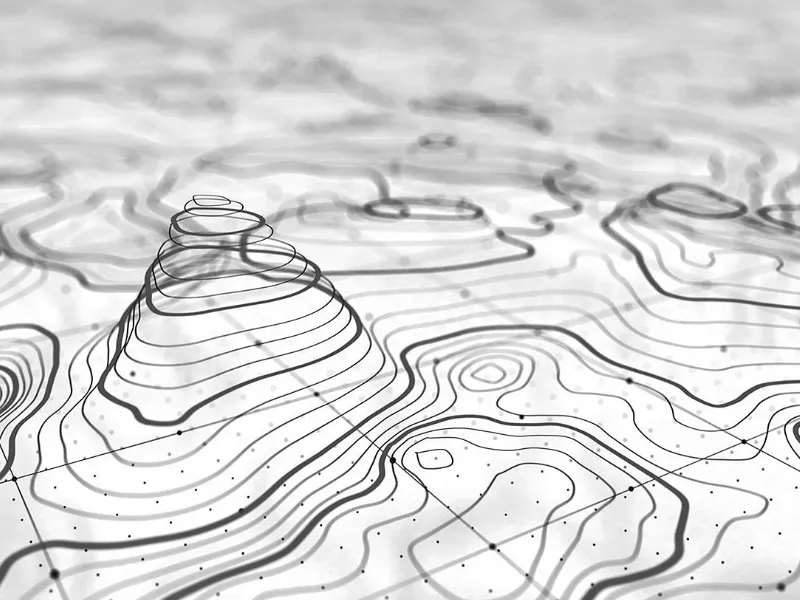
We would also like to mention that raster data is suitable for the representation of continuous data such as elevation, satellite imagery, etc. On the other hand, vector data is suitable to represent discrete data such as roads, landmarks and more. Also, raster data can lose quality when it is scaled up. However, vector data doesn’t lose quality when it is scaled up or down.
That said, we would now like to talk about the geometries of vector data. Stay with us as we are about to explore the different types and the unique roles they play in Geographic Information Systems.
To fully grasp the potential of vector data, it’s important to understand the vector data structure in GIS, which includes points, lines, and polygons used to represent real-world features with coordinate accuracy.
Geometries of Vector Data:
As we have mentioned earlier in the blog, vector data comprise three primary geometries: points, lines and polygons. We must mention that each geometry type happens to serve a specific purpose and is also utilized to represent different geographic features. Let’s have a look at each geometry type in detail!
Some widely used vector data examples include road networks, property boundaries, utility lines, administrative zones, and individual site locations.
Points:
In easy-to-understand words, a point is a single coordinate location in a given space. It has no length, width or area for that matter. A point is represented through a pair of coordinates (x, y) in a 2D space. It can also be represented in the form of three coordinates (x, y, z) in a 3D space.
- Usage: A point is used to represent a discrete location or object.
- Example: A point can represent a specific building’s location, individual cities on a map, etc.
Lines:
A line is a one-dimensional object which is defined by two or more connected points. It has length but doesn’t have width or area.
- Usage: A line is used to represent linear features.
- Examples: A line denotes roads, boundaries, rivers, etc.
Polygons:
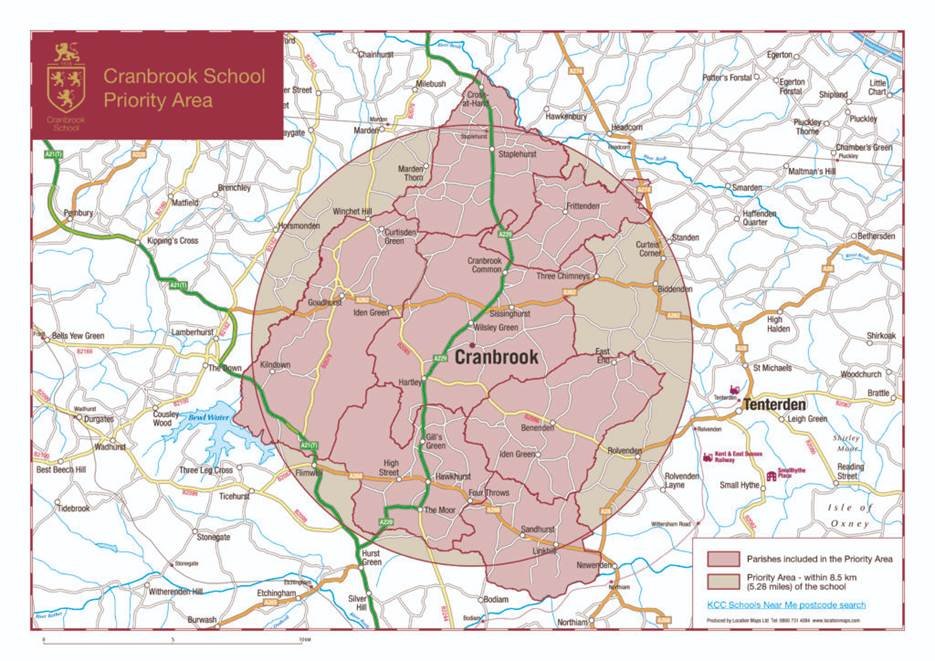
A polygon happens to be a two-dimensional shape which is defined by a series of connected lines, forming a closed loop. Polygons have length and width and they also enclose an area.
- Usage: Polygons are used to represent defined boundaries.
- Examples: A polygon represents lakes, land parcels, zones of land use, etc.
If that’s a lot of information to handle, allow us to mention that the usage of each geometry of the vector data is quite literally in its name. For example; points are for specific locations and lines are for linear features. Lastly, polygons are for areas with boundaries.
And now it is time to understand how vector data is used in GIS applications. We are sure it’s been an insightful journey with us so far. Keep reading the blog as there’s more to it!
Use of Vector Data in GIS Applications:
Through powerful vector data analysis, GIS professionals can perform proximity queries, overlay operations, and spatial pattern recognition to support decision-making in real-world applications.
Vector data is used in various GIS applications due to its accuracy and versatility. We must also add that vector data is an indispensable tool that enables precise mapping, detailed analysis of spatial relationships and more. In addition to that, vector data is considered highly invaluable as it allows informed decision-making for urban planners, policymakers, etc. Below are a few primary applications of vector data in GIS:
- Urban Planning and Management
- Transportation and Navigation
- Environmental Monitoring
- Cadastral Mapping
- Utilities and Infrastructure Management
- Disaster Management
- Real Estate and Property Analysis
Urban Planning and Management:
Vector data is instrumental in urban planning and management. Here is why:
It is used to create zoning maps which define land use types. For example; industrial, commercial and residential areas. In addition to that, vector data plays a vital role in infrastructure development as well. Professionals can efficiently plan road networks and public transport routes. Moreover, utilities can also be defined as vector data by representing streets, facilities and buildings.
Related: GIS in urban planning and management
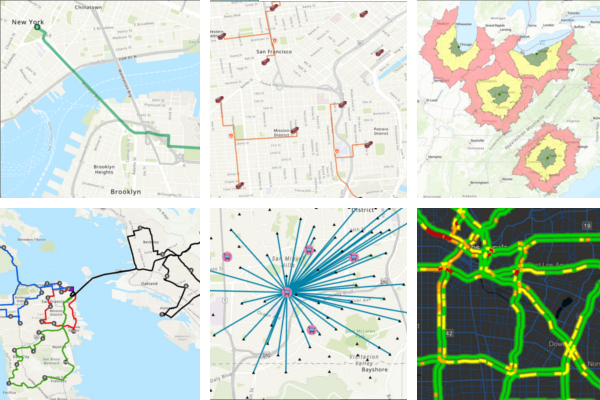
Transportation and Navigation:
Vector data plays a crucial role in transportation and navigation. Allow us to explain how:
To map and analyse transportation networks, vector data is super helpful. By using vector data, professionals can efficiently work on route planning and traffic management. Furthermore, Global Positioning System navigation (GPS) heavily relies on vector data. Do you want to know why? Well, by enabling real-time directions, vector data allows for accurate mapping of pathways, roads and highways.
Suggested: GIS and transportation planning
Environmental Monitoring:
Vector data is essential for effective environmental monitoring. Here is how:
To show and analyze different habitat types, vector data is used. It also helps in monitoring changes in land use. Biodiversity gets impacted when a change takes place in land use and vector data helps in studying that in detail. In addition, it is also used to outline pollution sources and then track their impact on the surrounding environments and inhabitants.
Related: Environmental GIS analysis
Cadastral Mapping:
Vector data is pivotal in shaping cadastral mapping. Continue reading the blog to learn how!
When it comes to cadastral mapping, vector data helps in creating property boundaries. This allows for effective handling of land ownership and documentation. We must also include that vector data facilitates land parcel management. It does so by helping in the strategic management of land parcels which cover property assessments, land use rights, etc.
Utilities and Infrastructure Management
Vector data plays an effective role in defining utilities and infrastructure management.
Mapping above-ground and underground utilities such as water pipes, telecommunication lines, etc. becomes easy with vector data. Additionally, vector data also helps in both tracking and managing maintenance activities. It is done by mapping the locations of infrastructure, pipelines as well as utility poles.
Disaster Management:
Vector data also helps in efficient disaster management. Keep reading the blog to learn how that happens.
Creating evacuation routes and identifying safe zones during disasters such as floods become much easier with vector data. In addition, damage assessment can also be done quite effectively by using vector data. By having access to vector data, professionals can map the affected areas and assess the extent of damage easily.
Real Estate and Property Analysis:
Vector data also enables real estate and property analysis in various ways. For example;
Professionals can analyse property boundaries, proximity to amenities, etc. by using vector data. In addition to that, site selection for development also becomes easier as professionals can utilize the insights they have on land use and zoning regulations.
Now, let’s have a look at the formats of vector data!
What are the Formats of Vector Data?
Vector data is stored and shared in different formats as per the needs & requirements of a specific GIS application. Understanding the various vector data formats is crucial to effective data management and to also perform GIS tasks.
Let’s explore the different types of formats of vector data in this part of the blog!
Shapefile (.shp):
The shapefile is one of the most commonly used formats in GIS. It consists of multiple files and the main files are known as .shp (geometry), .shx (shape index) and .dbf (attribute data). Shapefiles are capable of storing points, lines or polygons and are supported by almost all GIS software.
The benefit of using shapefile is that it is both simple and efficient to store vector data. However, it does not support topology and its size is limited to 2 GB.
GeoJSON (.geojson):
This format of vector data is based on JSON (JavaScript Object Notation). It is used to encode several geographic data structures. GeoJSON is a preferred choice in web mapping applications. Know that it is supported by multiple modern GIS tools and libraries.
GeoJSON is human-readable and can also handle complex geometries and nested attributes. We must mention that it is only limited to 2D data and is less efficient for large datasets.
KML/KMZ (.kml, .kmz)
Keyhole Markup Language or KML; an XML-based format was originally developed for Google Earth. On the other hand, KMZ is the compressed version of KML; accompanying KML files with other relevant resources such as images.
This vector data format is well-suited for visualization in Google Earth. Other web-based platforms can also make the most of it – as and when required. However, it may be less efficient for large datasets and has limited support for advanced GIS analysis.
GML (.gml):
Geography Markup Language (GML) is also an XML-based format for geographic data. It was developed by the Ocean Geospatial Consortium (OGC). GML is used for complex data modelling as it is highly customizable. It also enables efficient data exchange between different GIS systems.
We must mention here that even though GML allows for interoperability, it requires a deep understanding of XML to customize it. Moreover, it is not as user-friendly as other vector data formats.
DXF (.dxf):
The Drawing Exchange Format or DXF is a CAD format which was developed by Autodesk. It is widely used in the fields of engineering, architecture and construction. DXF is supported by multiple GIS applications. We must mention here that DXF is commonly used to import and export vector data between CAD and GIS environments.
As far as the benefits of DXF are concerned, it supports highly detailed vector data including 3D geometry. In addition to that, it also facilitates professionals such as engineers, architects, etc. to make informed decisions. But you must also know that it doesn’t store attribute data in the same way as other GIS formats do. Moreover, it is a complex format that may require conversion to be used in GIS.
Enhance Your GIS Accuracy with Vector Data!
Improve precision, streamline mapping, and make better decisions with expert GIS solutions. Contact us today!
📞 Schedule a Call | 📩 Email Us | 💼 Get a Quote Now
PostGIS (Spatial Database)
PostGIS is known to be an extension of the PostgreSQL database which allows storing and managing both raster data and vector data. PostGIS happens to be a powerful format when it comes to handling complex datasets. We must include that it is commonly used in enterprise-level GIS applications.
PostGIS supports advanced spatial queries and operations. In addition, it is highly scalable. You must also know that it can be seamlessly integrated with other GIS tools and datasets. However, it requires extensive database management knowledge. Also, it has a complex setup as compared to other file-based vector data formats.
If you have come this far, we are sure that you had a great time understanding vector data in GIS, its various applications and formats. We hope that you will be able to make the most of this comprehensive guide for your personal and professional needs. Feel free to contact us if you require more clarity regarding any aspect or implementation of vector data in your GIS applications.