Every oil and gas project begins with one constant, location. Whether exploring new basins, designing pipelines, or restoring decommissioned sites, every decision depends on place. But with rising exploration costs, stricter environmental rules, and pressure to reduce methane emissions, the industry faces narrower margins for error.
A Geographic Information System (GIS) gives oil and gas operators a single, spatially intelligent platform for mapping, analysing, and managing their entire asset network. It connects subsurface data, field sensors, land records, and environmental constraints into one clear picture, helping teams make decisions based on facts, not fragments.
For clients, that means fewer delays, faster compliance reporting, and better use of every pound or dollar invested in exploration, transport, or production.

Compliance Now Shapes GIS Roadmaps
Across major markets, regulation has become the biggest driver for GIS adoption.
In the European Union, Regulation (EU) 2024/1787 now requires oil and gas operators to conduct systematic leak detection and repair (LDAR), eliminate routine flaring, and report emissions tied to individual assets. In the United States, the Environmental Protection Agency (EPA) introduced new methane rules for both new and existing sources under Section 111(b) and 111(d), demanding verified reporting through digital records.
These policies make GIS a compliance backbone rather than an optional add-on. Operators can now:
- Map every well, valve, and compressor station.
- Overlay satellite or drone-based methane detections (e.g., MethaneSAT, Sentinel-5P).
- Log every leak, its repair date, and cost, directly onto the spatial database.
A 2024 analysis from MethaneSAT found that oil and gas methane emissions in the U.S. were four times higher than official EPA figures. In the Permian Basin, satellite data estimated 2.68 teragrams of methane released in 2024 alone, equivalent to the yearly emissions of 18 million cars. By visualising such findings within GIS, operators can prioritise high-risk assets, prove compliance faster, and show regulators quantifiable progress.
Early adopters gain a structural advantage: compliance becomes automated through mapped evidence rather than manual reports.
Data Sources Every GIS Must Integrate
A powerful GIS system depends on how many accurate layers it combines. In oil and gas, those layers typically include:
- Engineering & Design Data – pipeline centre-lines, facility footprints, CAD or BIM models, and well pads.
- Sensor Feeds – SCADA telemetry, fibre-optic Distributed Temperature Sensing (DTS), and mobile LDAR survey logs.
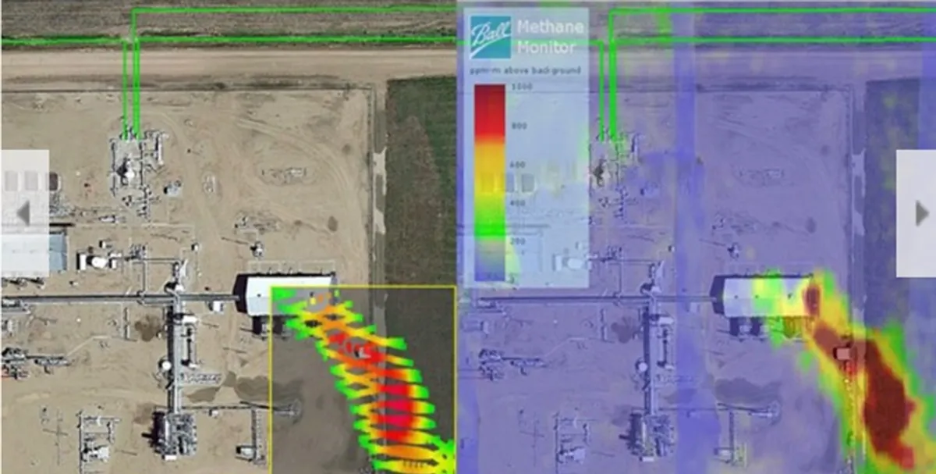
- Earth Observation Inputs – Sentinel-5P, MethaneSAT, and GHGSat imagery detecting methane plumes under 0.1 ton per hour.
- Land & Regulatory Layers – environmental protection zones, class-location maps, property boundaries, and concession licences.
Merging these datasets produces one accurate operational map instead of separate silos for engineering, environment, and compliance. It enables cross-department visibility, identifying leak clusters, encroachment zones, or permitting conflicts before they become costly.
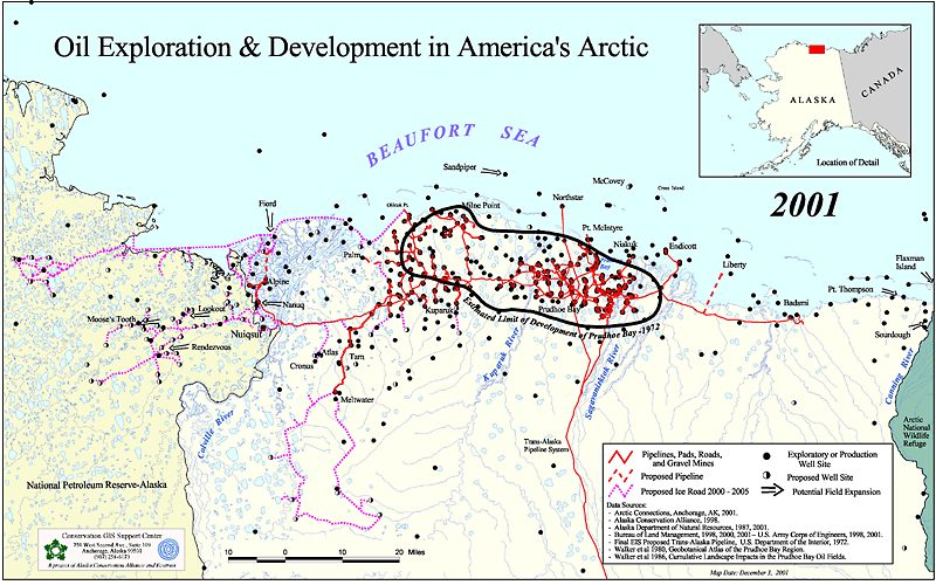
Upstream: Exploration and Field Development
Exploration budgets can exceed $100 million before drilling begins, and many wells still come up dry. GIS reduces that risk by helping teams visualise subsurface potential before any rig mobilises.
Site Selection and Lease Management
Using GIS, operators overlay lease boundaries, seismic grids, and environmental constraints to locate the most accessible and cost-efficient drilling zones. For instance, in Nigeria’s AKK gas project, spatial modelling cut site-selection time by nearly 40 percent by eliminating low-viability terrains early in planning.
Environmental Baselines
Before a field is developed, methane and soil-gas baselines captured in GIS form the benchmark for future LDAR comparisons. This digital history allows regulators to verify that emissions stayed within permissible limits throughout the project lifecycle.
Linking Subsurface and Surface Models
The Open Subsurface Data Universe (OSDU) provides the backbone for well data, while GIS visualises non-technical layers like land access, roads, and sensitive ecosystems. This creates a common map where geoscientists, land agents, and compliance officers can make decisions collaboratively.
In short, GIS turns exploration from a costly guess into a data-backed probability model, reducing risk and improving investor confidence before the first core sample is taken.
Need a clearer way to manage wells, pipelines, and facilities in one place?
Use GIS Navigator to combine engineering data, sensor feeds, and regulatory layers into a single operational map.
📞 Schedule a Call | 📩 Email Us | 💼 Contact Us
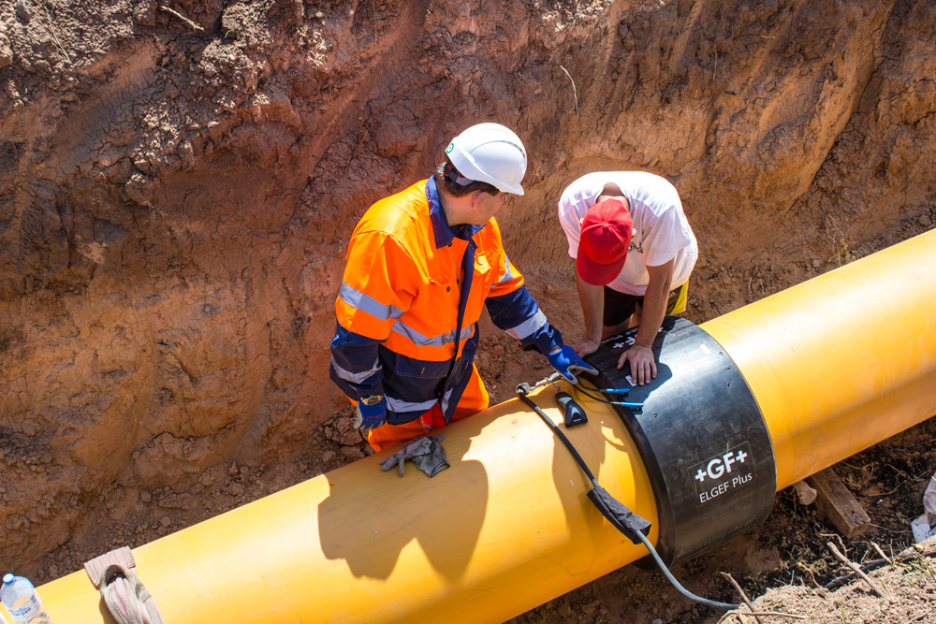
Midstream: Pipeline Routing, Integrity, and Operations
Routing and Permitting
Pipeline construction can cost up to $2 million per kilometre, meaning poor routing decisions have huge consequences. GIS supports route screening by combining terrain elevation, slope, land ownership, and heritage restrictions.
A 2024 study published in MDPI Applied Sciences showed GIS-based routing tools cut design time by 30% and reduced exposure to geohazards. By layering hydrology, population density, and construction cost maps, planners can visualise multiple corridor options and justify their choice to regulators and investors alike.
Network Modelling and Linear Referencing
Modern GIS systems such as Esri’s Utility Network build a digital twin of the entire midstream network, every pipeline centreline, pig launcher, valve, and repair record. Linear referencing allows teams to locate pressure anomalies or leaks precisely by distance markers rather than approximate GPS readings.
Integrity and Maintenance
Integrating In-Line Inspection (ILI) data and corrosion logs within GIS highlights risk clusters in real time. Operators can identify sections exposed to flooding or landslides and schedule preventive digs before failures occur. Pipeline integrity teams using GIS analytics report 20–25% fewer unplanned outages due to earlier interventions.
Operational Resilience
GIS also underpins emergency response. When hurricanes, wildfires, or earthquakes threaten operations, GIS overlays live weather feeds, identifies safe access routes, and models potential spill paths. This allows companies to activate rapid response with minimal downtime.
Downstream & Facility Management
Refineries and processing terminals must maintain continuous LDAR cycles and comply with emission caps. GIS automates this through:
- Inspection scheduling based on asset risk level.
- Spatial tagging of leaks detected via infrared cameras or drone imagery.
- Real-time dashboards showing leak status, repair progress, and cost.
New satellites like MethaneSAT (2024) and GHGSat-C10 now detect small plumes that older sensors missed. Integrating these detections in GIS gives facility managers early warning of super-emitter events. According to a 2025 ScienceDirect review, airborne methane mapping can cut LDAR detection time from weeks to less than 48 hours.
For clients, GIS turns leak control from reactive paperwork into a measurable and reportable system, supporting ESG reporting and investor transparency.
Carbon Management, Decommissioning, and New Energy
As global energy transitions accelerate, GIS also guides projects beyond traditional extraction.
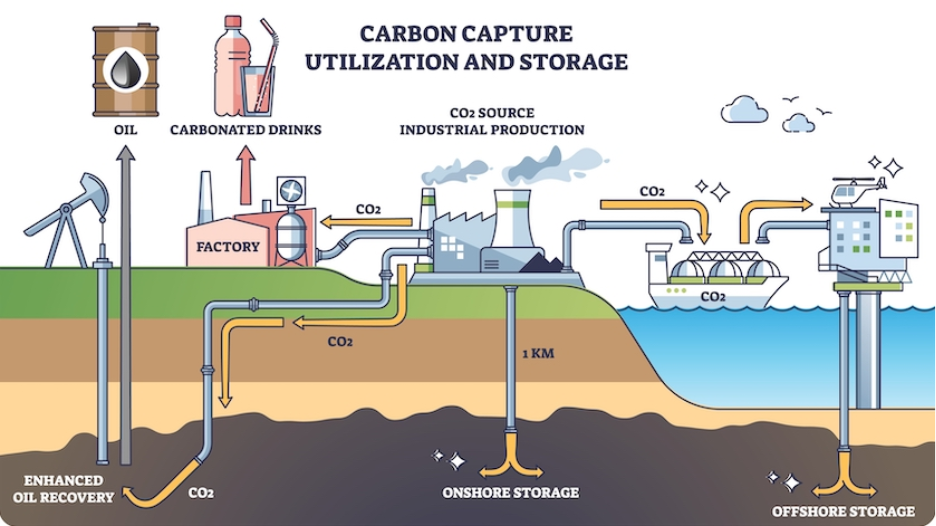
Carbon Capture and Storage (CCS)
GIS maps CO₂ emitters, storage reservoirs, pipeline routes, and monitoring wells. In the UK’s North Sea, the Northern Endurance Partnership uses GIS to track CO₂ injection sites and monitor reservoir pressure and plume spread. GIS models also forecast migration paths to ensure long-term containment.
Decommissioning and Legacy Wells
GIS identifies orphaned wells, maps proximity to aquifers, and supports risk classification for methane seepage. Regulators in Alberta, Canada, now require operators to submit GIS-based closure maps before decommissioning approval, improving public accountability.
Through these projects, GIS ensures legacy assets remain managed, monitored, and compliant even after production stops.
Architecture: How Modern GIS Fits into Energy Operations
A mature GIS platform operates across three layers:
- System of Record – the single authoritative database of wells, pipelines, and facilities.
- System of Insight – advanced spatial analytics that reveal cost, risk, and emissions trends.
- System of Engagement – web and mobile apps connecting inspectors, contractors, and executives.
When GIS integrates with SCADA systems, ERP platforms, and environmental sensors, decisions move from spreadsheets into live spatial context, visible to every stakeholder.
Metrics That Matter
Executives and ESG teams rely on quantifiable results. GIS supports metrics such as:
- Average time to detect and repair methane leaks (reduced by up to 50%).
- Tonnes of methane prevented through spatial tracking.
- Pipeline kilometres optimised through least-cost route modelling.
- Percentage of assets with complete GIS coverage year-over-year.
- Number of safety incidents or regulatory violations averted via early detection.
By tracking these figures, companies translate spatial mapping into business performance, proving that GIS delivers measurable returns, not just maps.
Read More: Isochrone Maps: What They Are?
Managing Risks Before They Escalate
Ignoring spatial data means operating blind. Terrain instability, leak clusters, or unpermitted encroachments can all lead to environmental fines or reputational loss.
Recent satellite monitoring by MethaneSAT and GHGSat revealed that global methane emissions remain about 70 percent higher than previously reported, exposing the gap between self-reported and actual figures. With GIS, organisations can close that gap by continuously correlating detected plumes with known assets and verifying the source quickly.
For clients, this translates into reduced liability, faster incident response, and stronger investor confidence.
Conclusion
Spatial awareness is no longer optional for oil and gas operators, it defines operational success. From the first exploration licence to final site restoration, GIS keeps every decision grounded in evidence. It improves efficiency, ensures compliance, and supports global carbon goals without adding complexity to workflows.
Oil and gas will continue to evolve, but one truth remains: understanding place means controlling risk.
Discuss your Oil & Gas GIS roadmap with GIS Navigator.
Our specialists can align your asset data, compliance reporting, and operational workflows in one spatial platform, helping you make decisions with clarity, confidence, and measurable value.