Politics is not only about laws or leadership, it’s about location. Where people live, how borders are drawn, and which areas gain access to resources all shape how power operates. Political science, once focused mainly on ideology and institutions, now relies heavily on spatial understanding.
Geographic Information Systems (GIS) bridge this gap between politics and place. By turning political data into maps, GIS helps researchers, policymakers, and institutions understand how geography influences governance, elections, and decision-making. From redrawing constituencies to visualising public protests, GIS provides a single view of political dynamics that were once hidden in spreadsheets and reports.
Today, governments, NGOs, and researchers use GIS to visualise how power, policy, and people interact, making political science more evidence-based and location-aware than ever before.
1. The Role of Geography in Politics
Geography has always shaped politics. Natural resources, terrain, and population clusters influence everything from economic growth to military strategy. GIS allows political scientists to visualise this relationship in precise, measurable ways.
For example, maps of population density, ethnic distribution, or infrastructure development can reveal why some regions prosper while others remain neglected.
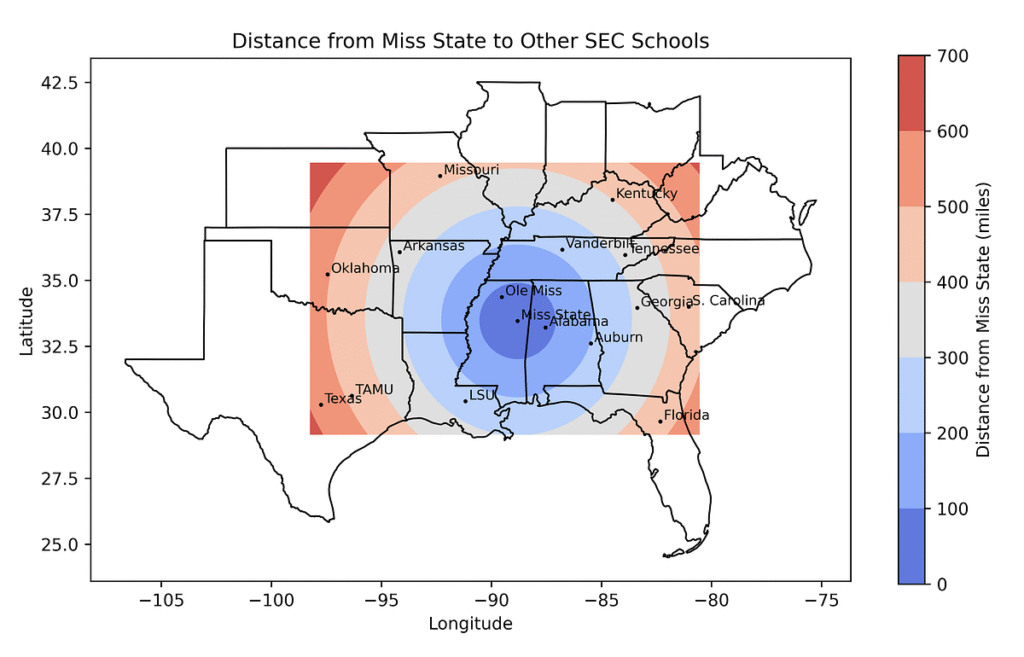
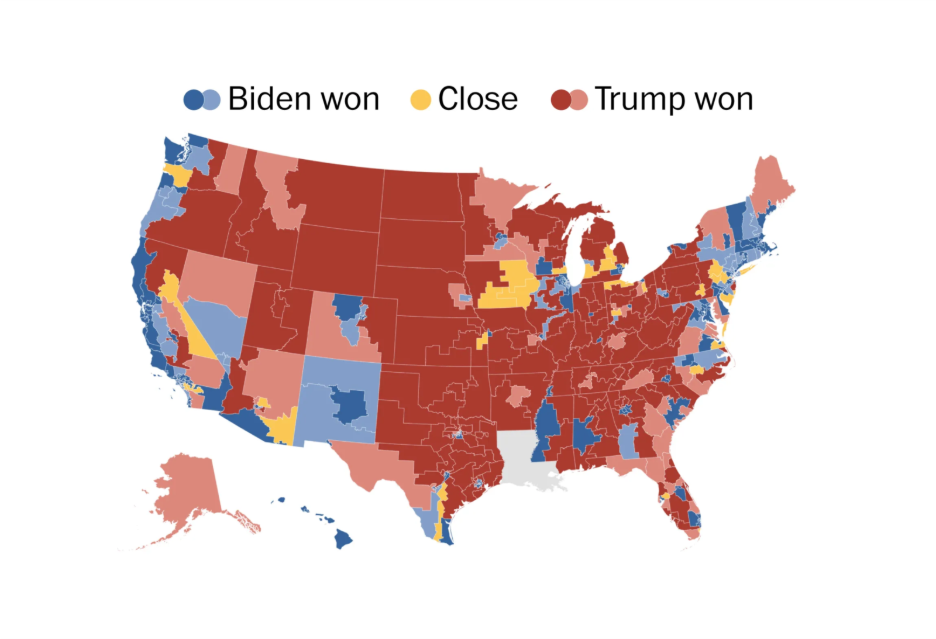
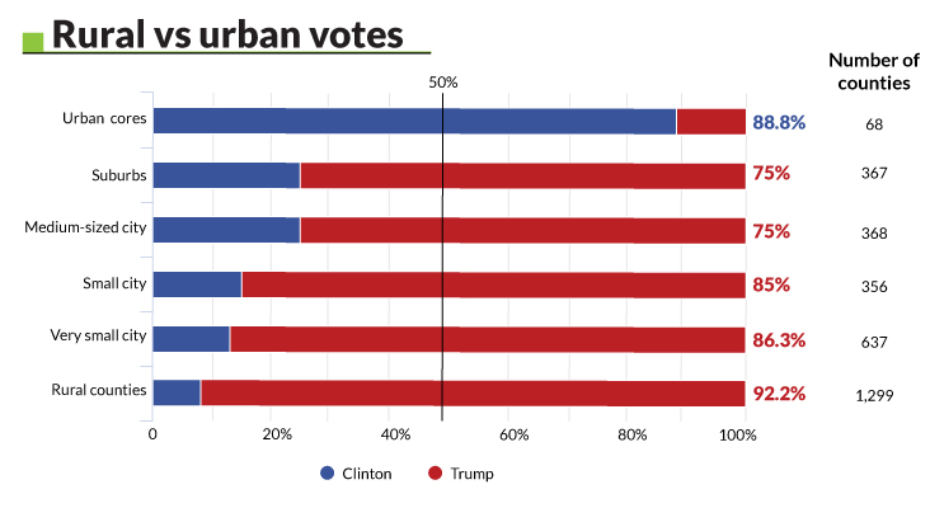
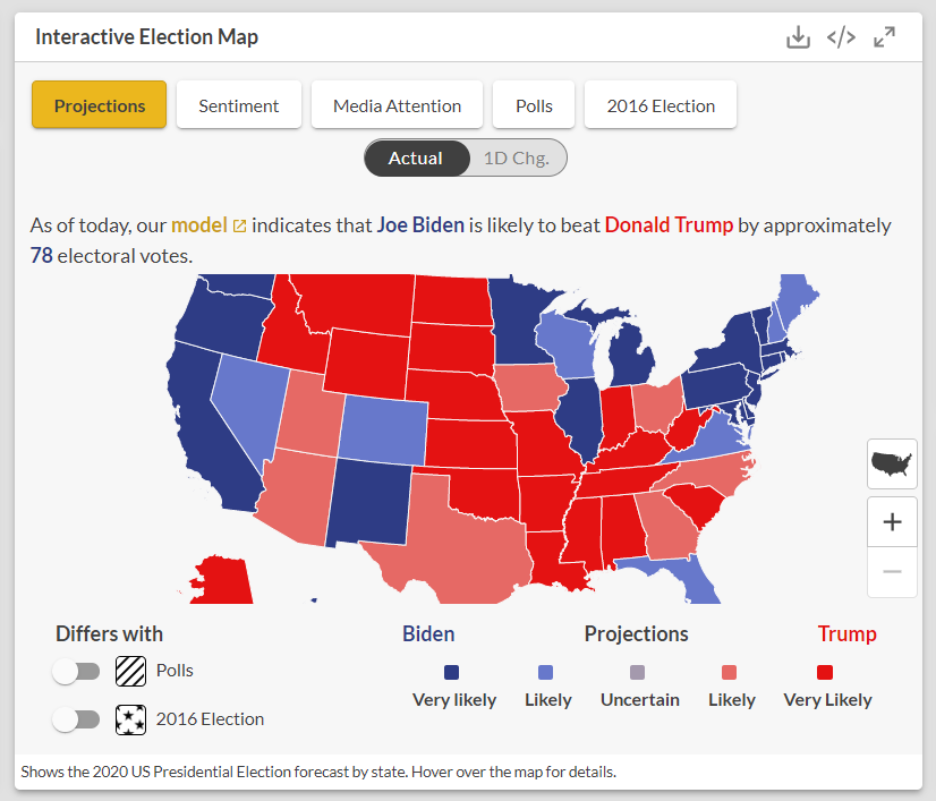
In the United States, GIS models show how urban areas lean towards one political party while rural regions tend to support another. In countries like India or Nigeria, GIS is used to map voting behaviour against literacy levels, income, and access to services, giving political researchers spatial clarity on inequality and governance.
By connecting data to location, GIS helps identify where policies succeed, why conflicts arise, and how citizens engage with their governments.
2. Electoral Mapping and Voter Behaviour Analysis
Elections are the foundation of modern democracy, and GIS now plays a central role in how they are planned, monitored, and analysed.
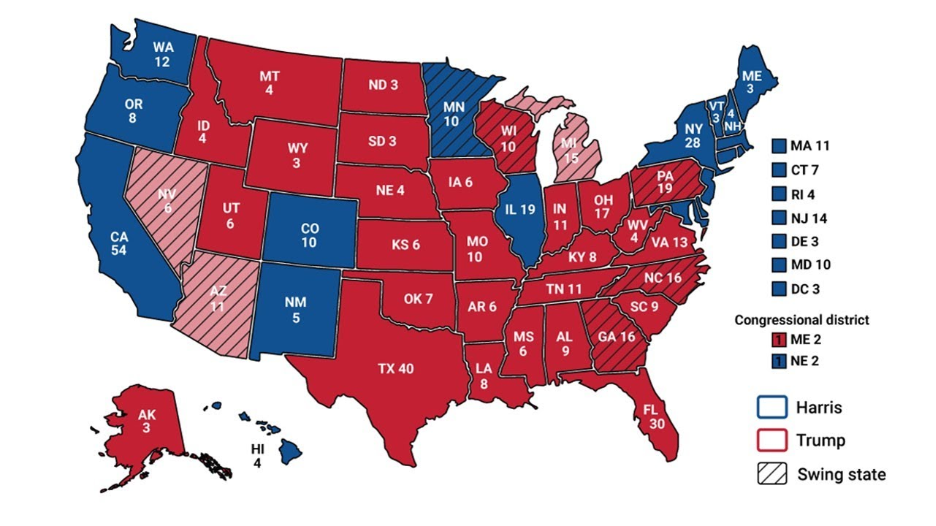
Election commissions and political analysts use GIS to manage electoral boundaries, track voter participation, and ensure fair representation. For instance, the U.S. Census Bureau uses GIS-based mapping during congressional redistricting to prevent biased boundary manipulation, a practice known as gerrymandering. The resulting maps show how even small line changes can shift electoral outcomes dramatically.
In Kenya’s 2022 general election, GIS dashboards monitored polling-station logistics, ballot distribution, and result reporting in real time, improving transparency. Similarly, India’s Election Commission employs GIS to check polling-booth accessibility for remote populations, ensuring citizens in hilly or rural areas are not excluded from voting.
GIS also allows researchers to analyse voter behaviour geographically, showing turnout patterns, campaign reach, and issue-based preferences across regions. For political strategists, this spatial understanding turns election planning from guesswork into data-driven precision.
Want clearer visibility into how people vote, move, and participate?
GIS Navigator provide GIS services to map voter behaviour, polling access, and region-wide electoral trends.
📞 Schedule a Call | 📩 Email Us | 💼 Contact Us
3. Policy Planning and Resource Allocation
Governments must often decide where to direct funds and which regions need the most support. GIS brings evidence into that decision-making.
Political scientists and policymakers use GIS to visualise how public services like schools, hospitals, or social programmes are distributed. By overlaying demographic and economic data, governments can quickly identify underserved regions and redirect investment.
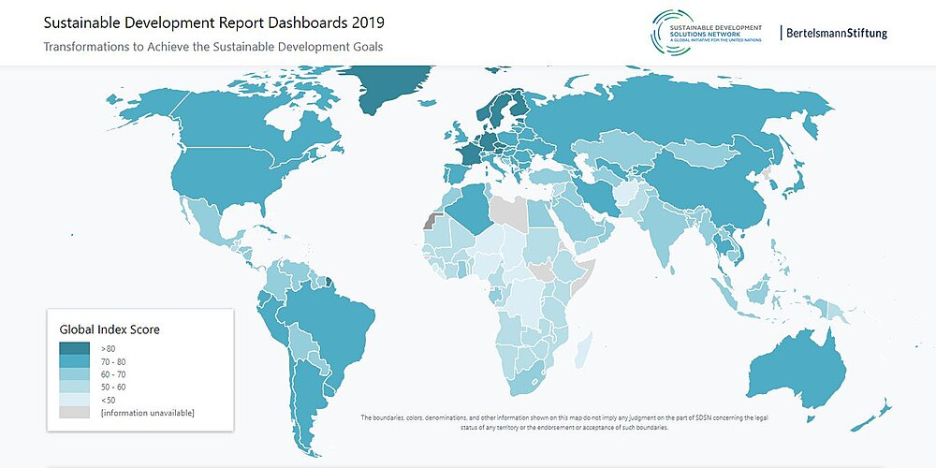
For example, the World Bank and UNDP use GIS to monitor progress on Sustainable Development Goals (SDGs), tracking education, poverty, and health data spatially. In India’s Aspirational Districts Programme, GIS mapping helps measure development gaps across 112 backward districts, allowing policy teams to allocate budgets based on real-time performance data.
This spatial approach ensures that resources are not just promised in policy speeches but delivered where they are needed most.
Need to spot which regions are underserved or overlooked?
Work with our team to build GIS maps that guide fair budgeting and targeted policy action.
📞 Schedule a Call | 📩 Email Us | 💼 Contact Us
4. Conflict, Security, and Geopolitical Analysis
Political conflicts often start with disputed geography, borders, resources, or territory. GIS gives governments and researchers a way to monitor and understand these disputes with accuracy and speed.
Peacekeeping agencies like NATO and the United Nations use GIS to track troop movements, refugee flows, and ceasefire violations. In the Russia–Ukraine war, satellite-based GIS platforms (including data from Planet Labs and Sentinel) have been used by journalists and analysts to verify territorial control and assess damage in civilian zones.
In Africa’s Sahel region, GIS supports mapping of insurgent activity, helping authorities predict conflict flashpoints and protect vulnerable communities.
GIS also aids in border negotiations, visualising resource zones or terrain constraints that influence diplomatic talks. For political scientists, these spatial records provide context behind security policies and international relations that raw data alone cannot explain.
5. Public Opinion and Social Movement Mapping
Politics extends beyond elections and parliaments, it lives in the streets, on social media, and in public spaces. GIS captures these movements in real time.
By combining geotagged social-media data with event reports, researchers can track the rise of protests, civic movements, and online activism. During the 2019 Hong Kong protests, analysts used GIS to visualise crowd gatherings, police deployments, and shifts in protest locations. In the 2020 U.S. Black Lives Matter movement, spatial mapping revealed how demonstrations spread from major cities to smaller towns within days.
GIS also helps analyse the geography of public sentiment, where people discuss environmental issues, human rights, or policy reforms most actively. This form of mapping gives political scientists insight into how information, influence, and ideology travel across regions.
6. Environmental Politics and Climate Policy
Environmental challenges have become political issues, and GIS now plays a major role in climate governance and environmental justice.
Policymakers use GIS to visualise areas affected by deforestation, flooding, or pollution, then compare those areas to demographic data. This helps governments see who is most impacted, and whether policies are protecting vulnerable communities effectively.
For example, the European Union’s Copernicus Programme provides GIS data on land use and emissions to support climate legislation. In developing countries, GIS helps analyse how drought or coastal flooding influences migration and, eventually, voting behaviour.
GIS also strengthens climate diplomacy, allowing nations to share transparent environmental data during global summits like COP28. For political scientists, these datasets reveal how environmental policy shapes global cooperation and domestic politics alike.
Check: Applications of GIS in Environmental Management
7. Challenges and Ethical Considerations
Like any data tool, GIS brings ethical challenges.
- Data Privacy: Geolocation data from citizens can expose sensitive information about political beliefs or community identity.
- Manipulation Risk: Poorly designed maps can mislead the public or be used to justify biased policies.
- Access Gap: Many developing nations still lack updated spatial data, leading to decisions based on incomplete maps.
Political scientists stress that GIS should promote transparency, not control. That means open data sharing, public verification, and ensuring maps represent people fairly, not as statistics, but as communities with real political voices.
Also Check: Use of GIS in Law Enforcement
8. The Future of GIS in Political Research and Decision-Making
The next generation of GIS in political science is moving toward real-time governance.
Advances in open data, remote sensing, and cloud computing now allow political analysts to visualise unfolding events, from live election results to emergency response coordination.
For example, AI-assisted GIS tools (used responsibly and transparently) are helping detect biased boundaries, monitor misinformation networks, and simulate policy outcomes spatially. In governance, ministries are adopting “geo-dashboards” to share updates on project delivery, corruption risk, or citizen feedback.
This evolution of GIS marks a shift toward spatial democracy, where data is not limited to governments or academics, but accessible to citizens demanding accountability and fairness.
Looking to apply GIS to your next governance strategy?
Partner with GIS Navigator to analyse borders, communities, and policy impact with clarity.
📞 Schedule a Call | 📩 Email Us | 💼 Contact Us
Conclusion
Politics has always been shaped by geography, but now, with GIS, that connection is visible in real time. It allows policymakers, researchers, and institutions to analyse how borders, resources, and populations interact. It reveals inequalities that maps once hid and provides tools to plan for a more equitable and informed society.
At its core, GIS makes political science more human. It helps leaders see not just statistics, but places, where people live, how they vote, and what they need from their governments.
At GIS Navigator, we help organisations, governments, and research bodies use spatial data to understand power and policy with clarity.
Talk to our experts to see how mapping can support your next governance, research, or social impact project.