Buffer analysis answers a common planning question: what lies within a set distance of a feature, and does that change the decision? It is used across UK planning, infrastructure and environmental work to screen constraints, quantify receptors and support safety judgements. This article sets out where buffers are useful, the modelling choices that make them defensible, the datasets and distance rules typically used in the UK, and how to deliver outputs that withstand scrutiny. By the end, you will know when a buffer is the right tool, what to watch for, and how to brief and sign off proximity work with confidence.
Where buffer analysis supports UK decisions
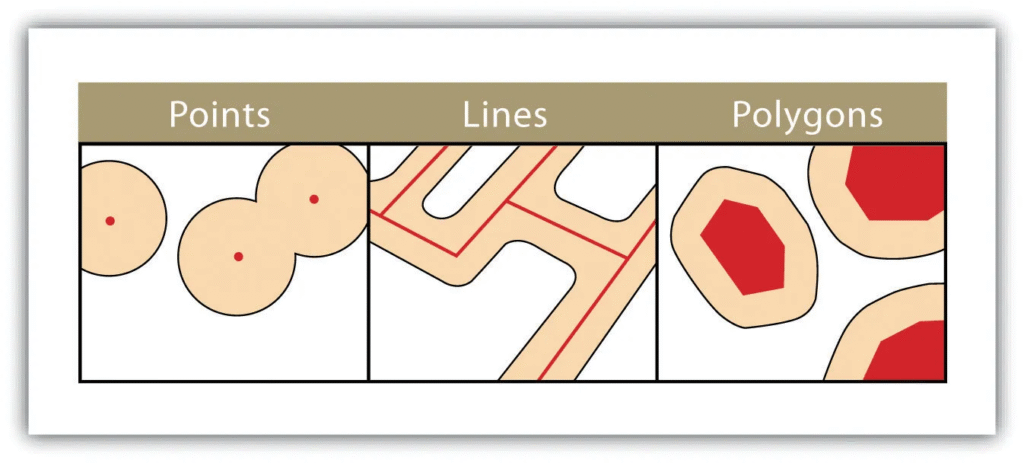
Buffer analysis is one of the most common GIS techniques used in UK planning, infrastructure and environmental work because it answers a simple question in a consistent way: “What’s within X distance of Y?” The output is usually a set of distance zones around a feature such as a site boundary, road, river, pipeline, mast, school or designated area.
In practice, buffers are rarely just a map. They sit inside decisions about feasibility, consent risk, safety and operational impact. A well specified buffer task can narrow options quickly, flag constraints early and provide an audit trail for why certain parcels, receptors or assets were included in assessment.
Common Proximity Questions And Outputs
Most buffer requests boil down to screening and counting. Teams want to know which constraints intersect a scheme, which receptors fall inside a consultation distance, or which assets are close enough to be affected by works. The most useful outputs are typically a buffer layer, often in multiple bands, an intersect or clip layer showing affected features, and a summary table of counts, areas or lengths.
Clients often expect a single right answer, but proximity results depend on how distance is measured, straight line or along a network, what geometry is used, point or polygon, and the accuracy of the source data. Good GIS delivery makes those choices explicit so the outputs are defensible.
Typical Planning, Utilities And Risk Contexts
In UK projects, buffers commonly support early stage constraint mapping for development sites, routing studies for linear infrastructure and risk screening around hazards. Utilities teams use buffers to understand potential third party impacts near apparatus, to plan access and work zones and to support stakeholder engagement.
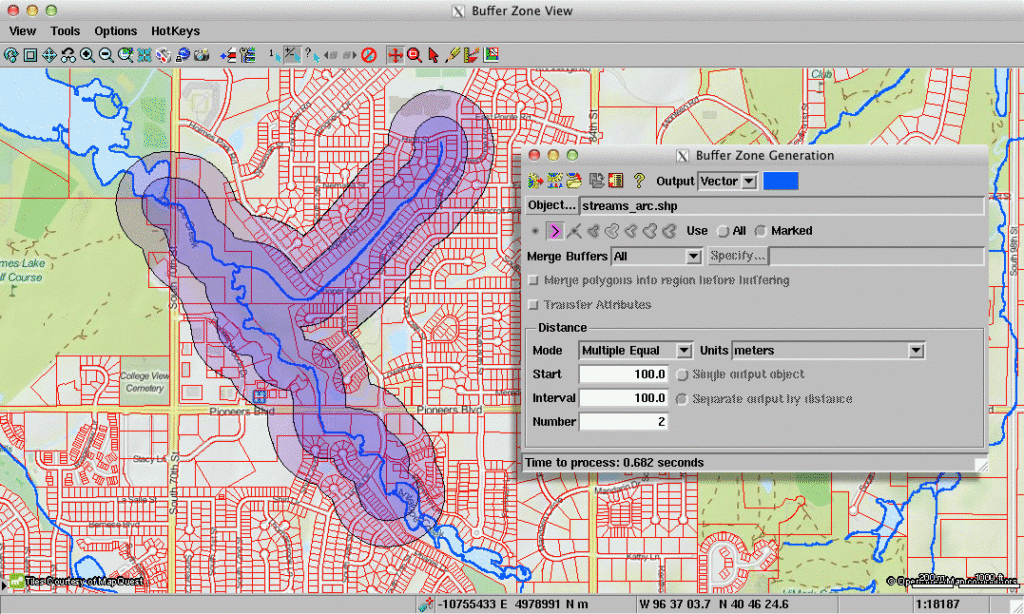
They also appear in environmental assessment, for example buffering watercourses, designated sites or sensitive habitats to create a consistent search area for baseline data and field survey planning. For wider context on how buffer analysis sits within broader workflows, it is part of everyday spatial analysis rather than a standalone trick, see what is spatial analysis -> https://gisnavigator.co.uk/what-is-spatial-analysis/.
When Buffers Are The Right Tool
Buffers are well suited when a distance threshold is meaningful and can be justified, for example a consultation zone, a safety stand off, a noise screening distance or an operational access corridor. They are also appropriate for rapid comparison between options, as long as the same assumptions are applied consistently.
They are not the right tool when travel time matters, for example emergency response, when topography significantly changes exposure, or when influence follows a network or a catchment rather than a circle. In those cases, a buffer can still be a useful first pass, but it should not be the final model.
Buffer Methods And Modelling Choices
Buffer analysis sounds straightforward until you have to defend the outputs. The modelling choices, how you represent the source feature, how you measure distance and how you treat overlaps, can materially change which receptors are in or out, and by how much.
In consultancy work, most effort goes into selecting the right method for the decision being made, then documenting it clearly. A 250 m buffer for a desk based constraint screening is different from a 250 m exclusion zone used to shape design decisions. The GIS needs to reflect that difference in how results are generated, checked and reported.
Buffer Types And Parameters
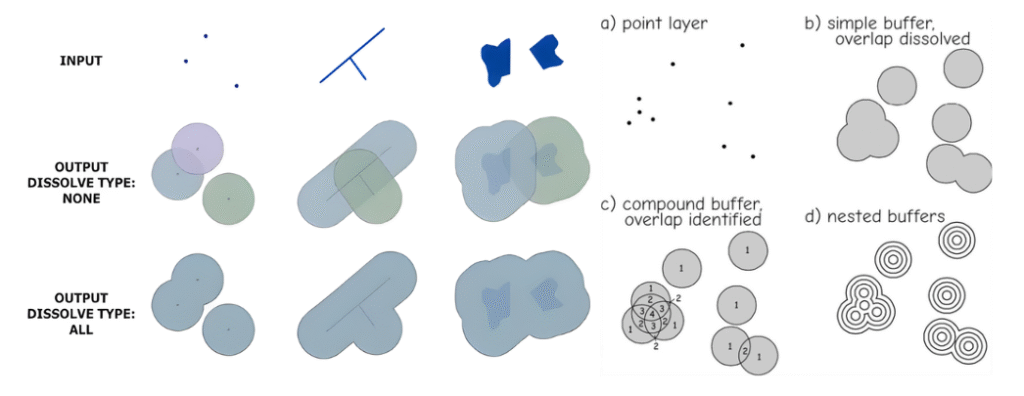
Common buffer types include single distance buffers, multi ring buffers such as 50, 100 and 250 m, and variable distance buffers where the distance depends on an attribute, for example pipe pressure class or road hierarchy. A key parameter is whether buffers are dissolved, merged, or kept separate per source feature, which affects downstream counting and area totals.
For linear features, end cap style, round, flat or square, can slightly change area and intersection results. For polygons, be clear whether you are buffering the boundary outward only, inward only, or both. This matters for sites where the distinction between within the red line and within X metres of the red line affects scope.
Coordinate Systems, Units And Accuracy
In the UK, buffering should generally be done in a projected coordinate system with metric units, most often British National Grid, OSGB36, EPSG:27700, for local and regional work. Doing buffers in geographic coordinates, latitude and longitude, risks distorted distances, especially across wider areas.
Accuracy is not just about the GIS tool, it is about the source geometry. A buffer around a generalised asset line, a digitised historic feature or an approximate point can imply a level of precision that is not there. If a safety decision depends on metres, the underlying data needs to be of appropriate quality, often informed by surveying and as built records, see GIS in surveying.
Network And Cost Distance Alternatives
When distance means travel along roads, footpaths, rail or utility corridors, network analysis is usually more defensible than a straight line buffer. An isochrone, for example a 10 minute drive time, answers different questions to a 5 km radius and is often closer to operational reality. If you are comparing accessibility or service coverage, this can be the difference between a credible output and a misleading one.
For movement across terrain or through land cover, for example identifying likely access routes across open ground, cost distance models can outperform buffers. They treat the landscape as a surface where some areas are harder to cross than others. If that is the requirement, it is better to scope it explicitly rather than stretching a buffer beyond what it can represent, related, network analysis in GIS.
Data Inputs And Distance Rules In The UK
Buffer analysis only works as well as the inputs and the rules applied. UK projects often involve combining multiple datasets, planning constraints, environmental designations, utility records and receptor layers, each with different update cycles, positional accuracy and licensing constraints.
It is also common for distance rules to come from a mix of policy, guidance, client standards and engineering judgement. The GIS role is to translate those rules into repeatable, documented processing steps and to flag where a distance is ambiguous, measured from what, to what, and under what assumptions.
Constraint And Designation Datasets
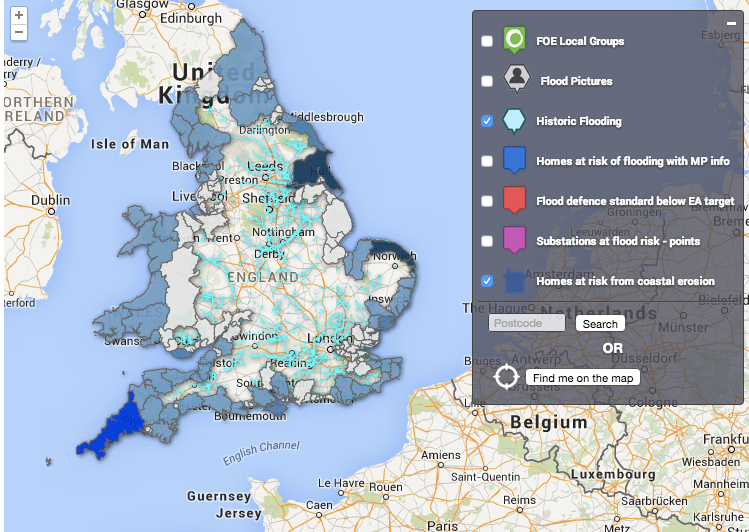
Typical UK constraint layers include statutory and non statutory designations, SSSI, SAC or SPA or Ramsar, Local Wildlife Sites, heritage assets, listed buildings, scheduled monuments, conservation areas, flood zones and landscape designations such as AONBs and National Parks. For planning screening, these are often buffered to create a consistent study area around a site or route, then intersected to report overlaps.
A recurring practical issue is boundary alignment. Different datasets may not perfectly match, and some boundaries are indicative rather than surveyed. When a buffer output is used to support planning statements, be explicit about dataset provenance and date, and treat the result as screening unless higher accuracy evidence is required.
Utilities, Hazards And Consultation Distances
Utilities teams frequently buffer around known assets and easements to support safe working, early clash detection and third party impact assessments. The challenge is that asset records vary. Some are high quality surveyed lines; others are schematic, incomplete or offset for security reasons. The buffer distance may also depend on asset type, voltage or pressure, depth or client standards.
Hazard related buffers can include zones around COMAH sites, pipelines or areas with known ground risk. Where consultation distances exist, the GIS should implement them exactly as specified and record the rule source. If a project needs to demonstrate safety compliance, agree early whether buffers are indicative screening or a design constraint that triggers engineering actions.
Receptors, Access And Demand Layers
Receptor layers, homes, schools, hospitals, water abstractions, ecological records or sensitive land uses, are often buffered or intersected with buffers to quantify potential impact. The choice of receptor representation matters. Using building footprints versus address points changes count outputs, and using centroid points can miss cases where a large building straddles a buffer boundary.
Access and demand layers, such as footpath networks, bus stops, service areas and customer demand points, often lead to debates about straight line proximity versus realistic travel. A common compromise is to provide both, a simple buffer based screening and a network based metric for operational planning, clearly labelled so they are not confused.
Delivery Workflow And Client Ready Outputs
A buffer task that stands up to scrutiny is usually about workflow discipline. The GIS processing itself is quick. What takes time is clarifying the question, standardising inputs, ensuring distances are applied in the correct units and producing outputs that can be trusted by non GIS stakeholders.
For UK clients, client ready typically means the map looks clear at the scale it will be used, the data can be loaded into the client’s GIS or CAD environment, and the numbers in tables reconcile with what the map shows. It also means the work is repeatable, because buffer requests often come back when boundaries move or a new constraint dataset is released.
End To End GIS Workflow And QA
A robust workflow starts with confirming inputs, feature types, geometry validity and coordinate reference system, and agreeing distance rules and output requirements. Buffers are created in an appropriate projected CRS, then checked visually and statistically, spot check distances, ensure no unexpected slivers, confirm dissolve behaviour.
QA should include testing edge cases, multipart features, overlapping sources and features near the study area boundary. On linear schemes, check whether buffering should follow a centreline, a corridor polygon or a chainage defined envelope, because each produces different results and different implications for reporting.
Overlay Metrics And Reporting Tables
Most buffer deliverables are only useful once overlaid with other layers. Intersections can produce counts of receptors within each band, area of constraint overlap or length of route within a designation. Reporting needs to match the decision. Planners usually care about constraint names and affected area; utilities may care about asset IDs and proximity bands; environmental teams often need receptor lists and distances for follow up.
One practical point. Overlay operations can double count when features overlap or when multiple buffers intersect the same receptor. Good reporting clarifies whether results are unique receptors affected or total intersections, and it documents any de duplication rules.
Maps, Datasets And Audit Ready Metadata
Clients typically need a map, PDF, GIS layers, GeoPackage, shapefile or file geodatabase, and a short method note. If the work will be used in a planning submission or safety case, metadata matters. Dataset sources, dates, coordinate system, buffer distances and any exclusions or assumptions should be stated clearly.
It is also worth agreeing symbology and labelling conventions early. A buffer map that looks fine in GIS can become misleading when exported at A3 for a report, especially if thin lines disappear or if transparency stacks in confusing ways. Deliverables should be tested in the format the client will actually use.
Limitations And Scoping Guidance
Buffer analysis is popular because it is easy to run, but it is also easy to misuse. The main limitations are conceptual, is distance the right proxy, data driven, are inputs accurate enough, and interpretive, are stakeholders likely to treat indicative outputs as precise.
Scoping is where many projects succeed or fail. A small amount of time spent agreeing the distance rules, the measurement method and the purpose of the output can prevent rework and avoid uncomfortable conversations later, especially when buffer results are used to justify design decisions or stakeholder communications.
Selecting Defensible Distance Thresholds
Distance thresholds should come from an identifiable source, legislation, guidance, standards, client policy or a documented professional judgement. If there is not a clear rule, it is often better to present scenarios, for example 50, 100 and 250 m, than to imply a single threshold is definitive.
Defensibility also depends on how you measure from and to. For example, within 250 m of the site could mean from the site boundary, from the development footprint or from a specific emission source. Agreeing that definition early avoids disagreement when results are reviewed.
Common Pitfalls And Validation Checks
A frequent pitfall is buffering in the wrong CRS or mixing layers with different coordinate systems and assuming the software will handle it. Another is buffering poor quality geometries and presenting the result as if it is survey accurate. Sliver polygons from overlay operations can inflate counts or areas if not dissolved or cleaned appropriately.
Validation checks should include basic sanity tests, do the buffers look the right size at known locations, reconciliation against expected totals and a clear record of any geometry fixes applied. If the output will be used for risk decisions, include a small sample of manually checked distances as part of QA.
Briefing, Responsibilities And Sign Off
Buffer analysis often sits between disciplines. Planning, engineering, environment and operations may all interpret the outputs differently. A good brief clarifies who owns the distance rules, who signs off assumptions and what the outputs can and cannot be used for.
If you are commissioning a buffer based study, ask for a short method statement and a clear deliverables list before the work starts. If you want a second opinion on whether buffers are the right approach for your question, or whether network or surface modelling would be more defensible, our team can talk through options and help you scope a workflow that matches how the results will be used.
Conclusion
Buffer analysis is a simple but powerful way to understand proximity and support planning, risk and design decisions. Its value depends on using appropriate data, clearly defined distance rules and transparent methods. When applied carefully, it provides quick, defensible insights; when misused, it can mislead. The key is knowing when a buffer is the right tool and ensuring the outputs match how they will be used.