We live in a data-driven world where almost everything is measured and analysed as per certain needs and requirements. Geospatial information or data also helps various industries in several ways. But what exactly is geospatial data and how does it facilitate informed decision-making?
In this article, we aim to explore the world of geospatial data and how it stands out as one of the most powerful tools available. Make sure you read the article until the end to equip yourselves with knowledge to help you understand the world around you.
Make Better Decisions with Geospatial Data
Harness the power of accurate location-based insights to streamline operations, reduce risks, and improve efficiency. Explore how GIS Navigator can help your business make data-driven decisions.
📞 Schedule a Call | 📩 Email Us | 💼 Get a Quote Now
What is Geospatial Data?
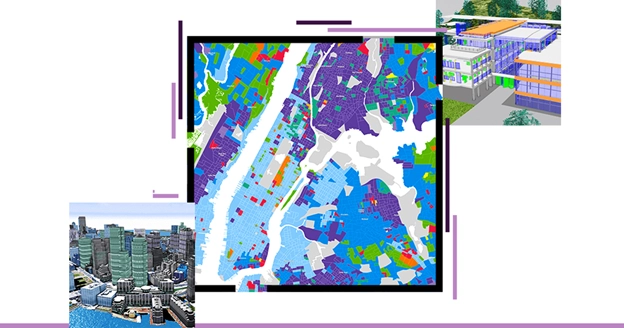
Geospatial data is also known as geographic information and refers to the data that is associated with a certain location on the surface of the Earth. The highly extensive geospatial data not only covers information such as relevant coordinates but also shows identifiers which define the location of objects or events.
In addition, geospatial data also covers different types of phenomena such as population density, weather patterns and environmental changes. Geospatial data can also share information on land uses and social behaviors. This makes geospatial data indispensable for several applications such as urban planning, environmental management and more.
Importance and Applications of Geospatial Data in Various Fields
Geospatial data facilitates various types of decision-making for professionals such as engineers, environmentalists, etc. In this part of the article, we will share the applications of geospatial data. We are sure you would know that geospatial data is crucial for urban planning. However, it goes beyond urban planning and development. For example; geospatial data is vital in agriculture as it helps with crop health monitoring. In addition, professionals can also boost irrigation and predict yields
That’s still not it as geospatial data also helps environmentalists track deforestation and evaluate climate change. Moreover, businesses can assess market trends and determine delivery routes. By doing so, they get to optimize their services and improve customer experiences. Allow us to share a few more applications of geospatial data to help you better understand it.
Cadastral Mapping:
Geospatial data plays an essential role in cadastral mapping. Such mapping is important when it comes to land ownership, boundaries and more. Cadastral mapping is utilized to carry out various tasks such as property tax assessment, land dispute resolution etc.
Utilities Management:
Geospatial data also helps in effective utility management such as water, gas and electricity. With the help of geospatial data, the professionals can ensure fair and efficient distribution of resources, their maintenance and emergency response. We must also add here that with geospatial data, certain risks can be identified and taken care of such as leak detection in water pipelines.
Disaster Management:
Geospatial data is not only an excellent tool for mapping but also allows for assessing risk and preparing for disasters well before time. In addition, it also helps the professionals work on emergency response efforts. When it comes to disaster management, geospatial data is utilized in hazard mapping, disaster impact analysis and post-disaster recovery efforts.
Types of Geospatial Data
There are two primary types of geospatial data; vector data and raster data. In this part of the article, we will explain the types along with their examples and use cases. So, continue reading it as there’s much more to uncover about the geospatial data types.
Vector Data:
Vector data is used to represent real-world features by utilizing geometrical shapes. This type of data plays an important role in Geographic Information Systems (GIS) – allowing stakeholders to make informed decisions. Vector data shows geographic information using points, lines and polygons which are then defined by coordinates.
There are three key components of vector data. Let’s explore each one of them!
Points happen to be the most basic vector element. They are used to represent a single location on a certain map. Points are used to represent those features which are too small to be represented as areas or lines. They denote a bus stop, the location of a post box or a wall.
Lines, on the other hand, are created using connected points resulting in linear features. We must add that lines are also called polylines. Lines represent features that have length but don’t have width such as a hiking trail, a river, etc.
Polygons are two-dimensional shapes, with length and width and enclose an area on a map. Polygons are used to show zones of land use, administrative regions and more.
Raster Data:
Raster data is quite different from vector data as it represents the data in the form grid of cells or pixels. These cells show a specific value and are part of a continuous format. For example; the raster data represents elevation, satellite imagery, land cover, etc.
Let’s have a look at the key characteristics of raster data!
Need high-quality geospatial data for your projects?
Grids and Pixels:
Grid is the framework of rows and columns in raster data known as a grid. It divides the geographic area into uniform and well-organized forms. Each cell in any given grid corresponds to a specific location on the surface of the Earth.
Digital Elevation Models (DEMs) are an example of a grid. It’s a representation of a terrain’s surface which is created from elevation data. Some other examples of grids are land cover mapping, land use and climate models.
Pixels are the smallest units of a grid in raster data. You must know that a pixel is a short form of a ‘picture element’ that represents a single point in a geographic area. We must mention that this geographic area is covered by the raster.
A few examples of pixels are satellite imagery, remote sensing and digital photography. We will be explaining them later in the article.
Collection of Geospatial Data Collection
Do you consult Google Maps before going to someplace new? Do you wonder how the Maps take you exactly where you need to be? Have you also wondered how weather apps on our smart devices predict heavy rains accurately? Well, the answer is simple; the intricate geospatial data collection and creation make it feasible. However, it takes more than just data collection through sensors, etc. For example; the spatial data collection process begins by gathering data in raw form. This data is collected utilizing satellites, GPS devices, drones and other modern sensors. The highly detailed data comprises information about Earth’s surface and includes imagery, terrain elevation as well as temperature data.
The collected data has to undergo multiple stages of processing before it is made available for the concerned stakeholders to be used. For instance; the process of data cleaning takes place during which all sorts of errors and even inconsistencies are eliminated. Then, the process of data transformation takes place. During this step, the obtained information gets converted into a usable format.
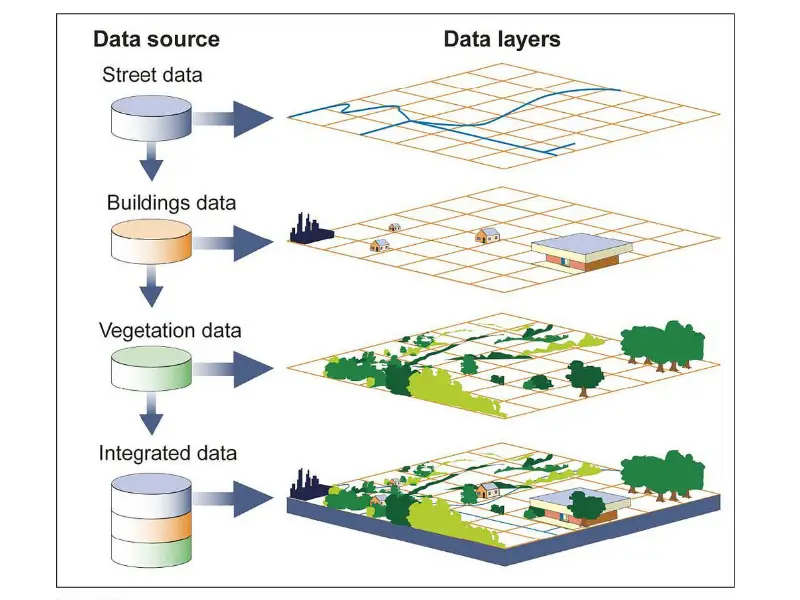
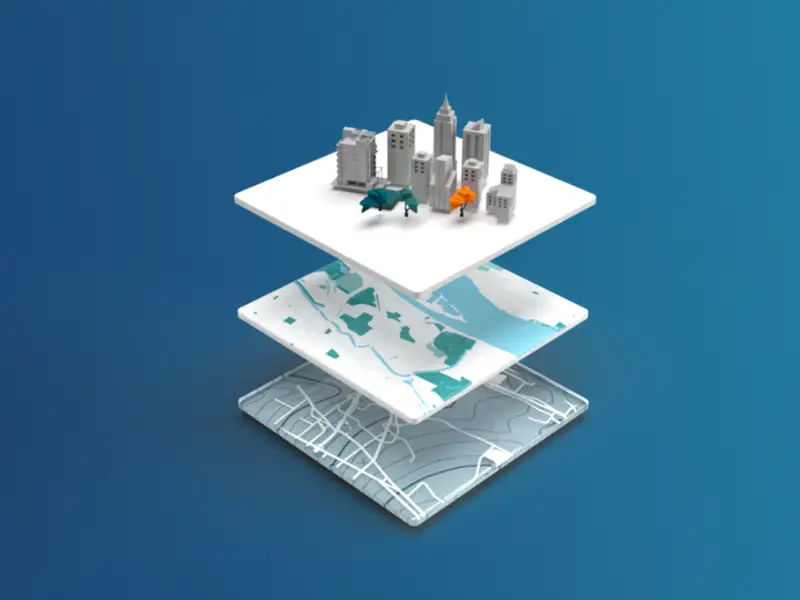
Here, you must also know that the geospatial data has many layers. This means that there are several types of data available within geospatial data. The data can include both natural and man-made elements such as weather patterns, land use and roads. All the information is then combined to develop comprehensive maps and models. This is when Geographic Information Systems (GIS) are utilized to analyse the data in detail. What happens next is an interesting part of the process as it reveals the patterns, trends and other relationships that are not immediately evident.
From satellite imagery to field surveys, we provide reliable geospatial solutions.
Remote Sensing:
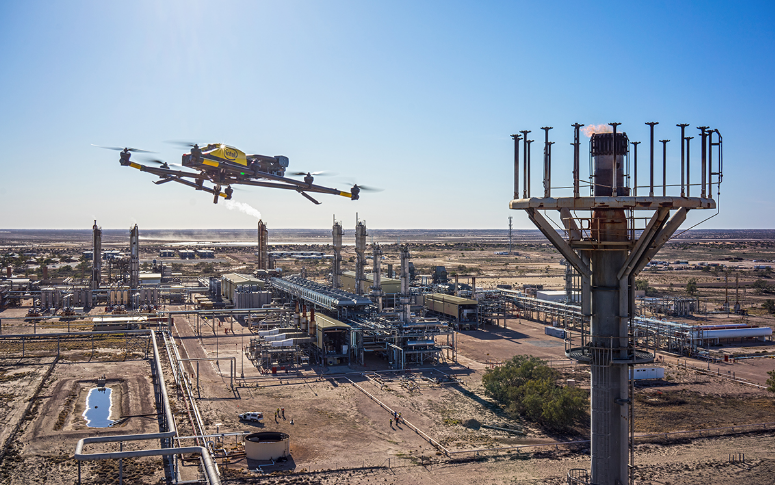
Remote sensing is the process of collecting data from a distance. This process takes place by using satellites or aircraft. The sensors, then capture images and other required data that shape the way forward. The two ways of getting the job done are through satellite imagery and aerial photography. Satellite imagery is images of the Earth which are taken by satellites in space. Other planets can also be monitored using such satellites.
Satellite imagery is used for urban planning, weather forecasting, agricultural monitoring and disaster management. On the other hand, aerial photography helps in taking images of the Earth from an elevated position. This is done by utilizing balloons, drones, etc. Environmentalists, urban planning developers and archaeologists benefit from aerial photography in their respective fields.
Surveying:
The process of surveying takes place by utilizing ground surveying techniques. By doing so, the Earth’s surface is effectively measured and mapped. The process of surveying involves data collection directly from the ground which determines the positions of points, angles and elevations. Ground surveys are highly essential for mapping, land development and construction.
A couple of ground surveying methods include; GPS Surveying, Total Station Surveying, Radiation Method and more.
Volunteered Geographic Information (VGI):
The name says it all but allow us to mention that VGI is the data which is collected, created and disseminated by individuals voluntarily. This is done by using web-based platforms, mobile apps as well as social media. VGI allows non-professionals to share geospatial information across various platforms.
VGI is user-generated content and a type of crowdsourcing where volunteers can create and share data using their smartphones. In addition to that, individuals can also make the most of their social media platforms to collect and distribute geospatial data.
Existing Data Sources:
As the name suggests, an existing data resource refers to the information that has been already collected and processed. This is done by multiple institutions and organizations for their tasks. However, what happens is that the researchers, analysts, etc. do not collect new data from being in the field and use pre-existing data sources to get things done. By doing so, they not only save their time and money but also get to spend their resources on other important projects.
There are two sources of such data; government databases and commercial data providers. Government agencies and private data providers collect, create and manage data as per their requirements as well as the needs of the researchers. Both entities can sell the data at a minimal cost or share it free of cost with the masses.
Struggling with Location Data? We Simplify It for You
Understanding spatial data shouldn’t be complicated. Our expert GIS solutions transform raw data into actionable insights, helping you plan with confidence. Get in touch to see how we can support your needs.
📞 Schedule a Call | 📩 Email Us | 💼 Get a Quote Now
Creation of Geospatial Data
The process of generating data representing the location, shape and other characteristics of features of the Earth’s surface is known as the creation of geospatial data. This created data is used in Geographic Information Systems (GIS). There are two ways to represent such data; vector data and raster data. Additionally, there are two methods through which geospatial data creation takes place.
Digitizing:
The process of converting analogue information into digital format is known as digitizing. For example; converting paper maps into digital format. The features on a physical map are traced and represented as vector data such as points, lines or polygons. By doing so, the data is made accessible to a larger group of people who can store, manipulate and analyse it as per their requirements. Digitizing can be done using manual and automated digitizing techniques.
Geocoding:
The process of converting descriptive location information into geographic coordinates (longitude and latitude) is called geocoding. This is called address geocoding. By doing so, the location can be accurately placed on a map. Geocoding involves using a database of known locations to match the descriptive information with a specific point on the surface of the Earth.
There is another type of geocoding, reverse geocoding. It is the exact opposite of address geocoding. In this process, the geographic coordinates are converted into human-readable addresses.
Geospatial Data Analysis
In easy-to-understand words, the process of geospatial data analysis involves examining and interpreting data. This data is linked to specific geographic locations and is used to reveal patterns and relationships within a certain area. The process of geospatial data analysis takes place by utilizing modern software tools which allow professionals to explore spatial relationships and more present in the data. One such example of a software tool is the Geographic Information Systems or GIS.
Key Elements of Geospatial Data Analysis:
In this part of the article, we’re going to be talking about the key elements of geospatial data analysis.
1. Spatial Relationships: They allow an understanding of how different geographic features relate to one another in a specific space. Let us explain that with examples. Analyzing spatial relationships shows how a water body can affect land use. Or the population density in a specific area can impact future urban development.
2. Pattern Detection: This allows the identification of recurring patterns within the data that is being analysed. And do you know what’s the best thing about pattern detection? Well, it can also help GIS professionals detect disease outbreaks and resource distribution. In addition to that, the professionals can identify migration patterns as well.
3. Visualization: The process of visualization helps represent the data visually in the form of maps, graphs and charts. These visual aids facilitate the process of understanding complex spatial data. Visualization is essential for geospatial data analysis – mainly because it aids GIS professionals in interpreting the data and then communicating the results to other stakeholders.
4. Modelling & Prediction: In this process, the spatial data is utilized to create models that are efficient enough to predict future trends. Here are two examples to help you better understand the process:
- It allows accurate prediction of the impact of climate change in a specific location.
- It allows for predicting the traffic flow based on current events in a certain area.
5. Decision-Making: The careful analysis of the obtained data allows for informed decision-making in various industries. For example; urban planning, public health sector, environmental management and more.
Conversion of Geospatial Data
The process of transforming geospatial data from one format, data model or coordinate system to another is known as the conversion of geospatial data. This is done to ensure that different datasets can be worked upon and used together in GIS.
Converting between vector and raster formats (and vice versa): It refers to converting data from points, lines and polygons to the grid of cells (and vice versa).
Converting data between GIS and architects: It refers to converting data between Geographic Information Systems into formats that are compatible with architectural tools.
Coordinate Systems and Projection Conversion
There are different types of coordinate systems such as:
Geographic Coordinate System (GCS): It uses longitude and latitude to denote locations on the Earth’s surface.
Project Coordinate System (PCS): It uses linear units to project the Earth’s surface onto a flat plane.
Data transformation can happen in several ways for example; Coordinate System Transformation, Format Conversion, Data Model Conversion and Attribute Data Transformation. The process of transformation is important as it allows for interoperability. In addition to that, accuracy across the spatial data can also be ensured through data transformation.
Data Integration refers to the process of combining and unifying data from different sources. This is done to get access to detailed and accurate datasets. By doing so, different datasets can work together – ensuring visualization and informed decision-making. Data integration is crucial as it enables comprehensive analysis of the data. Moreover, it also ensures streamlining workflows for different professionals in their fields.
Tools and Software for Geospatial Data Handling
GIS Software:
Some popular GIS Software include ArcGIS, QGIS and Google Earth Pro. Allow us to briefly explain what they are:
ArcGIS: It is a comprehensive GIS platform that offers tools for mapping, spatial analysis and data management. Its features include advanced spatial analysis, 3D modelling and integration of data.
QGIS: It is an open-source GIS platform that offers extensive tools for mapping, spatial analysis as well as visualization. It supports multiple data formats, plugins and analysis tools.
Google Earth Pro: It is a cloud-based platform to analyse large-scale geospatial data as well as satellite imagery. One of the key features includes having access to vast satellite imagery datasets.
Remote Sensing Software:
Remote sensing software processes, analyses and interprets data that is collected from remote sensing technologies. These technologies include drones, satellites and other aircraft. Some of the powerful tools to get the job done are:
- Google Earth Engine
- Envi
- Erdan Emagine
Programming and Automation:
Using programming languages such as Python, R and others for geospatial data analysis allows access to their libraries and extensive tools. By leveraging such languages, processing, analyzing and visualizing spatial data become much easier and more efficient. We must ass here that these languages are capable of handling large datasets. In addition, custom geospatial applications can also be created using programming languages. This allows for performing complex analyses quite easily.
Some commonly used geospatial libraries are GDAL and Shapely. Allows us to briefly explain what they are.
GDAL: This library offers reading and writing of several geospatial data formats. In addition, projections can also be performed utilizing GDAL.
Shapely: It provides the users with geometric operations to manipulate and analyze planar geometric objects. These objects can be points, lines and polygons.
Challenges in Geospatial Data
While working with geospatial data, individuals can face several challenges that might impact their work progress and planning. Some of the challenges are stated below:
Data Quality and Accuracy: At times, geospatial data can be more than just complex. And that only means one thing; compromised quality and accuracy of data.
Data Privacy and Security: Geospatial data can include sensitive information and there’s a high chance of it getting misused by the troublemakers. This can also raise concerns for data privacy and security.
Big Data and Storage: Since the geospatial data is highly detailed, it requires significant storage capacity. This can be quite a challenge to manage and process data.
Applications of Geospatial Data
There are various applications of geospatial data. Allow us to briefly explain them down below:
Urban Planning: Geospatial data allows for efficient urban planning and development. It not only allows the professionals to design and optimize infrastructure and zoning but also enables them to assess land use, population density and more.
Environmental Monitoring: Geospatial data is crucial for effective environmental monitoring. It includes biodiversity, deforestation, habitat loss, etc.
Agriculture: When it comes to optimizing farming practices, predicting yields and improving crop health, geospatial data plays a vital role. In addition, it also helps in effective agricultural resource management.
Transportation: Public transport and route management for delivery services become easily doable with geospatial data. Moreover, with the help of geospatial data, professionals can also monitor and improve traffic flows in a given area.
Put Your Data to Work for Smarter Planning
Geospatial data is more than just maps—it’s the key to optimizing workflows and improving decision-making across industries. Discover how GIS Navigator’s solutions can help you make the most of your data.
📞 Schedule a Call | 📩 Email Us | 💼 Get a Quote Now
Conclusion
Geospatial data helps us understand and manage our world in the context of its spatial aspects. It allows for better decision-making in urban planning, agriculture, environmental conservation, etc. The data is collected through different methods including remote sensing, aerial photography and more. The data is then processed into two primary formats; vector data and raster data. As far as the analysis of such data is concerned, that is done by leveraging GPS software. The software extracts insights and we must also mention that the processed data is converted in such a way that it is compatible across multiple applications.
How would you like to utilize geospatial data for your personal or commercial projects? Get in touch with GIS Navigator today and our team of experts will take it from there!