1. Why Land Classification Shapes Every Rural Decision
The reality of agriculture and rural planning is deceptively complex. Two fields can lie side by side, share the same rainfall, and receive the same sunlight; yet one thrives while the other consistently under-produces. The critical difference lies not in the farmer’s effort, but in the unseen, fundamental characteristics of the land itself, its suitability and classification.
For the past decade, working in the trenches of rural development, we’ve learned that guessing is not a strategy. Whether you are a farmer deciding which specific crop variety to plant, a rural planner selecting the optimal, low-erosion site for a new irrigation canal, or a conservation team assessing the ecological health of a watershed, accurate Land Classification is not merely helpful; it is essential.
This is where the power of modern Raster Classification Maps comes into play. Created using Geographic Information Systems (GIS) and modern satellite imagery, these maps allow us to categorize every square meter of a landscape based on measurable, continuous values like soil moisture, vegetation health, slope angle, and flood patterns. They transform a vast, complex territory into clear, actionable zones.
These maps are now vital, indispensable tools for:
- Agriculture: Determining crop suitability analysis and enabling precision farming.
- Forestry & Natural Resources Management: Monitoring health and planning sustainable harvesting.
- Flood Modelling & Environmental Risk Analysis: Identifying high-hazard areas for disaster mitigation.
- Rural Development and Planning: Strategically locating infrastructure and assessing land value.
- Land Cover and Land-Use Monitoring: Tracking changes over time for policy enforcement.
In this comprehensive guide, we will break down exactly what land classification is, how the unique structure of Raster Data makes it powerful, and why these maps are the single most authoritative resource for modern rural planning.
2. What is Land Classification?
2.1. Land Classification
At its core, Land Classification is the systematic process of grouping contiguous areas of land into discrete, predefined categories. This grouping is based on a specific set of measurable physical and environmental characteristics, such as:
- Soil type and nutrient profile
- Vegetation type and density (or the lack thereof)
- Terrain features (slope, elevation, aspect)
- Moisture content and water availability
- Flood risk and drainage
- Land cover (what physically covers the surface)
It is the necessary step that turns raw, overwhelming geophysical data into concise, meaningful, decision-making information that anyone from a government official to a smallholder farmer can understand and use.
2.2. Why Raster Data is Used
To fully grasp the power of this process, you need to understand the data format we rely on: Raster Data.
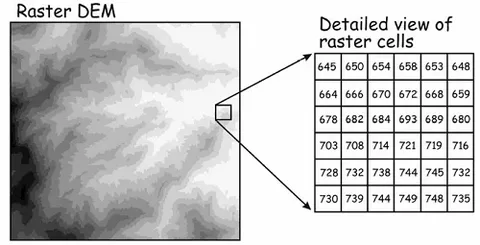
Think of a raster map not as a traditional hand-drawn map, but as a high-resolution, digital photograph, one that is made up of millions of tiny, identically sized, square blocks known as pixels or cells. The key difference is that each of these individual pixels doesn’t just display a color; it stores a specific, real-world continuous value for that exact location.
This allows us to create surfaces representing:
- Slope (e.g., in degrees)
- NDVI (Normalized Difference Vegetation Index, a measure of plant health)
- Soil moisture (e.g., 15% saturation)
- Flood depth (e.g., 1.5 meters)
- Rainfall (e.g., 1200 mm per year)
Because these are continuous surfaces, raster data is ideal for classification. We can simply re-group the continuous pixel values into simple, actionable classes: for instance, all pixels with a slope value less than 8 degrees become the class “Low Slope/Low Erosion Risk.”
The result is a classified map with discrete, easy-to-read zones, such as:
- High fertility
- Medium slope
- Flood-prone
- Dense vegetation
2.3. Key Land Classes Used in Agriculture
Our daily work relies on classifying land into universally recognized categories that directly impact policy and planning. Common classes generated through this process include:
- Arable land (suitable and currently used for annual crops)
- Grassland / Grazing land (used for livestock)
- Forest cover (timber production, conservation, or fuel wood)
- Water bodies (lakes, rivers, reservoirs)
- Wetlands (critical conservation areas)
- Built-up / developed areas (settlements, roads, infrastructure)
- Degraded land (areas suffering from severe erosion or desertification)
- Bare soil & shrublands
These distinct classes support everything from national land-use policy to a single farmer’s strategic planning decisions.
3. How Raster Classification Works in GIS
But how do we go from raw satellite data; just a mass of numbers; to these clear, meaningful zones? The magic lies in the classification process, which requires both technical tools and expert human oversight.
3.1. Data Preparation
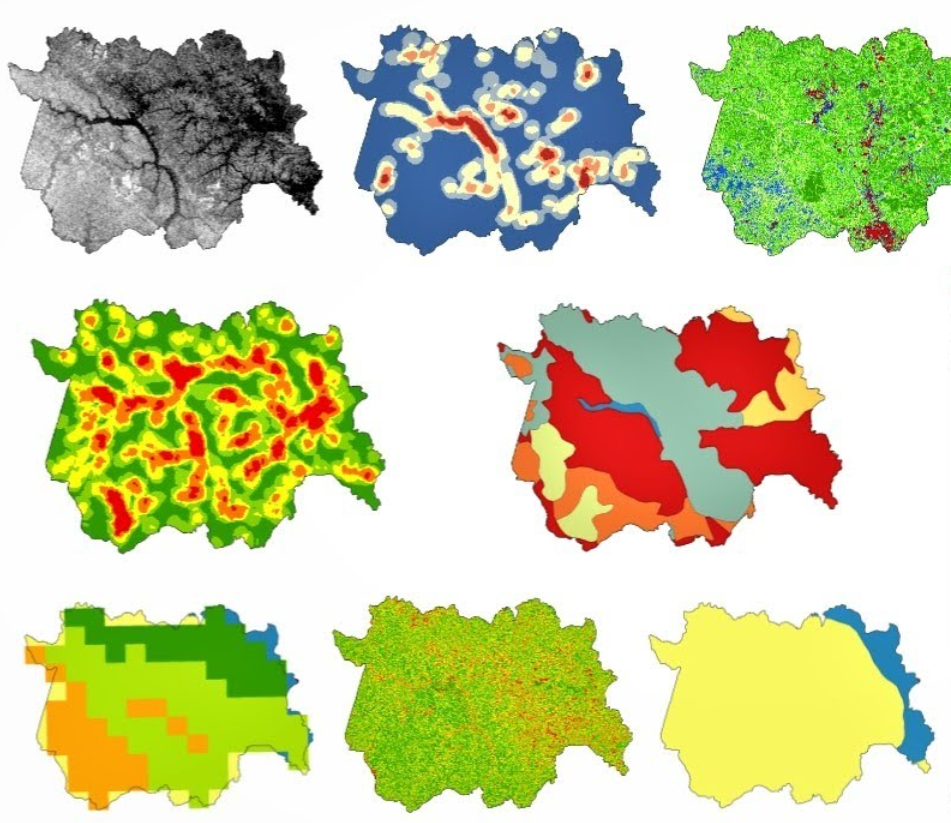
Before any classification can happen, we must compile and prepare multiple raster inputs. This is the foundation of accuracy. We need to gather:
- Satellite Imagery: We rely on free, medium-resolution sources like Sentinel-2 (10m resolution) and Landsat 8/9 (30m resolution), as well as higher-resolution, commercial options like PlanetScope (3–5m) for detailed farm-level work.
- DEM (Digital Elevation Model): The source for all terrain data, Slope, Aspect (direction of slope), and Elevation.
- Soil maps: Crucial layers providing detail on texture, depth, and chemistry.
- Vegetation indices: Calculated layers like NDVI (plant health) and EVI (enhanced vegetation index).
- Flood-depth grids: From hydrological models, showing potential water levels.
- Climate layers: Rainfall, evapotranspiration, and temperature data.
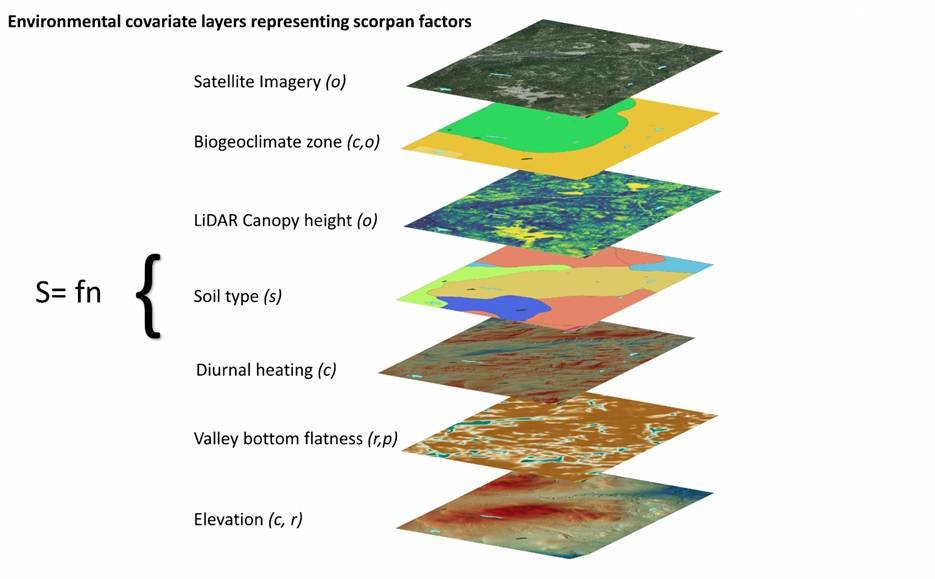
All these diverse datasets are then cleaned, accurately aligned (georeferenced), and processed for uniformity before classification can begin.
3.2. Types of Raster Classification
We rely on four primary methods to transform the raw data into classified maps, each serving a different purpose and scale:
Unsupervised Classification (K-Means, ISO Cluster)
In this approach, the computer is given the raw imagery and asked to organize the pixels into a predefined number of natural clusters (e.g., 10 or 15 groups) based purely on their spectral (color) similarities.
- Analogy: It’s like sorting a pile of colored LEGO blocks without knowing what the final structure is meant to be. The machine simply groups all the blue blocks together, all the green blocks together, etc.
- Application: Useful for very large areas, initial reconnaissance, or when the land characteristics are largely unknown. The analyst must then interpret what each generated cluster actually represents (e.g., Cluster 3 is “Forest,” Cluster 8 is “Water”).
Supervised Classification (Random Forest, SVM, Maximum Likelihood)
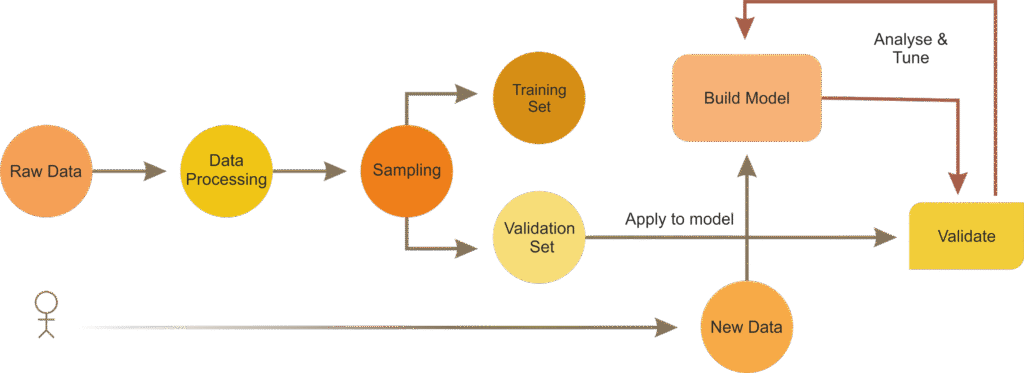
This is the preferred, high-accuracy method, where the analyst trains the computer. We manually select numerous training samples, specific, verified areas on the map that we know are a certain class (e.g., drawing 50 polygons over areas verified as “Wheat Crop,” 50 over “Bare Soil,” etc.).
- Analogy: It’s like training a machine to recognize a specific breed of dog by showing it a hundred pictures of that dog and a hundred pictures of other animals. The machine learns the distinct spectral “signature” of that class.
- Application: Provides much higher accuracy than unsupervised methods, especially critical for agricultural monitoring, detailed land-use planning, and high-stakes projects. We predominantly use sophisticated, machine-learning based algorithms like Random Forest for their robustness.
Rule-Based Classification
This method relies entirely on expert knowledge and logic (which is often derived from the experience of people like us). We define explicit rules using measurable thresholds:
- Rule Example: IF slope is low AND soil fertility is high AND flood risk is low THEN Classify as Highly Suitable Arable Land.
- Application: Perfect for Multi-Criteria Suitability Analysis (MCSA) (covered in Section 6), as it allows us to encode real-world planning constraints directly into the GIS model.
Threshold Classification
The simplest form, using a single, clear cut-off value on one input layer.
- Example: Any pixel with NDVI >0.4 is classified as “Healthy Vegetation”; any pixel with Slope >25 degrees is classified as “High Erosion Risk/Unsuitable for Cultivation.”
3.3. Outputs of Raster Classification
The result of this rigorous process is not just a single map, but a powerful portfolio of classified outputs that drives decision-making:
- Land cover maps (forest, cropland, grassland, urban, water)
- Agricultural suitability maps (identifying best zones for specific crops)
- Productivity zone maps (essential for precision farming)
- Flood hazard classification (based on recurrence and depth)
- Environmental sensitivity maps (e.g., biodiversity hotspots, erosion zones)
These comprehensive outputs are utilized by every level of stakeholder, from national ministries setting policy to local farmers requesting a bank loan for expansion.
4. Data Inputs for Land Classification (Essential Components)
A classification map is only as good as the data layers that feed into it. As field professionals, we know that omitting even one critical layer can render a suitability map useless or, worse, dangerously misleading.
4.1. Satellite Imagery
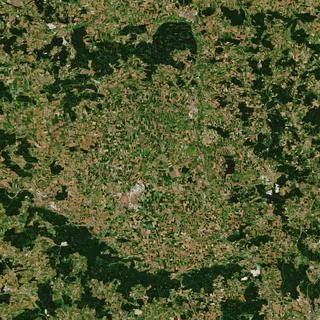
The foundation of our analysis is the multi-spectral data captured by earth-observing satellites. These sensors capture light reflected not just in the visible spectrum, but in non-visible bands (like Near-Infrared) that are crucial for determining vegetation health.
- Sentinel-2 and Landsat: We rely on these free sources for continental-scale, routine monitoring and long-term change detection.
- Why it’s essential: Satellite bands are used to calculate indices like NDVI, EVI, and SAVI, which quantify crop growth, forest health, and drought stress, metrics no physical survey can match in speed and coverage.
4.2. Terrain Data
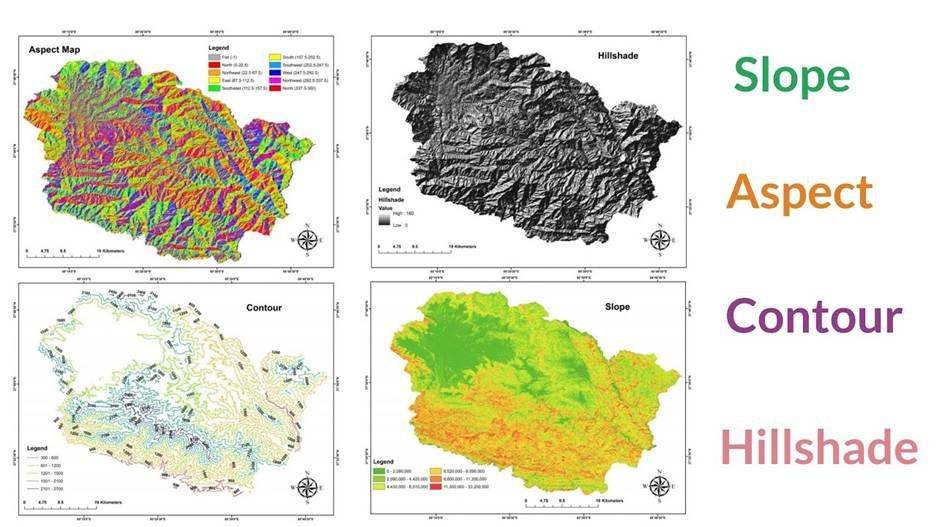
Derived from Digital Elevation Models (DEMs) (sources like SRTM, ALOS, or high-accuracy LiDAR), the terrain layer is arguably the most fundamental input after the satellite image itself.
- Key components: Slope, Aspect, Elevation, and Terrain Ruggedness.
- Why it’s essential: Satellite imagery shows what is growing, but terrain data dictates where and how water flows. It is critical for erosion modelling, determining the feasibility of gravity-fed irrigation planning, and strategic infrastructure placement. A low-slope area is inherently less risky and more suitable for almost any rural activity.
4.3. Soil Data
Soil data, the ‘silent partner’ in the suitability model, often comes from existing geological surveys or targeted field sampling.
- Key components: Soil type (texture), Organic matter content, pH level, Drainage class, and Water-holding capacity.
- Why it’s essential: This layer determines the absolute biological potential of the land. No amount of rainfall can compensate for critically low pH or poor drainage. Soil data is the ultimate filter that determines what crops will grow successfully and where.
4.4. Hydrological Data
This layer covers the surface water network and its potential impact.
- Key components: Streams, rivers, defined flood zones, and watershed boundaries.
- Why it’s essential: It helps us assess the flood hazard for infrastructure placement and, conversely, the irrigation potential and water accessibility for farming. We classify areas by their proximity to reliable water sources.
4.5. Climate Data
Often overlooked for local planning, climate data is essential for the long-term sustainability and viability of any large-scale project.
- Key components: Mean annual Rainfall, Temperature ranges, Growing Degree Days (GDD), and Evapotranspiration rates.
- Why it’s essential: It provides macro-level constraints, classifying land based on its ability to support a crop over an entire growing season. For instance, classifying a region as suitable for high-yield maize requires a minimum GDD threshold, which only the climate layer can provide.
5. Practical Applications: How Land Classification Supports Farming & Rural Planning
The real value of these complex technical processes is demonstrated through their direct, powerful impact on the ground. We have utilized these maps to change outcomes in every major sector of the rural economy.
5.1. Agricultural Crop Suitability Analysis
This is perhaps the most direct and impactful application. Classification maps answer the high-stakes questions for farmers and agricultural investors: Which crops will grow best here? and What are the inherent risk factors?
The GIS model doesn’t guess; it runs the expert rules: it merges areas where (Soil pH > 6.0), (Slope <8 degrees), (Drainage Class = Good), and (Rainfall >700 mm). The resulting classified map identifies optimal zones for:
- Staple crops: Wheat, Rice, Maize.
- Cash crops: Cotton, Sugarcane.
- High-value perennial crops: Fruit orchards, vineyards, and vegetable farms.
This is foundational to minimizing risk and maximizing yield.
5.2. Precision Farming Zones
At the sub-field level, raster classification underpins precision farming. Once we classify a field, we stop treating it as a uniform block. Instead, we create productivity zone maps:
- High-yield zones: Receive slightly reduced seed/fertilizer rates.
- Low-yield zones: Receive higher fertilizer or targeted remediation.
- Irrigation needs zones: Based on soil moisture classifications.
This process enables Variable-Rate Fertilizer Mapping, saving input costs while increasing overall crop uniformity and yield.
5.3. Livestock Grazing Suitability
For livestock management, we use classification to design sustainable rotational grazing systems. GIS classifies areas based on:
- Grassland conditions (NDVI/biomass)
- Distance to water points (crucial for range health)
- Slope (steep slopes are inaccessible or dangerous for continuous grazing)
- Carrying capacity estimates derived from vegetation biomass.
5.4. Forestry Management
Forestry classification is essential for long-term resource management and environmental protection:
- It helps identify suitable areas for timber production based on terrain and existing species.
- It is used to detect forest health issues (e.g., pest outbreaks) by mapping sudden drops in NDVI.
- Critically, it maps fire-prone zones by integrating vegetation type, fuel load, and proximity to settlements, informing fire prevention strategies.
5.5. Flood and Environmental Risk Modelling
In the face of climate change, these maps are a core asset for disaster management authorities.
- Flood Depth Mapping: Classifying areas by the anticipated depth of water (<0.5m, 0.5–1m, >1m) guides evacuation and infrastructure protection.
- Soil Erosion Risk Zoning: Combining slope, rainfall intensity, and soil type to classify high-risk areas, guiding conservation tillage and terracing projects.
- Environmental Sensitivity Assessments: Classifying and protecting wetlands or critical wildlife corridors.
5.6. Rural Infrastructure Planning
For government officials and development agencies, classification maps ensure that new investments are durable and strategic. Rural infrastructure planning uses these maps to decide where to build:
- Rural roads and transport networks: Avoid areas with high waterlogging or severe erosion risk.
- Storage and warehousing: Locate facilities on stable ground near high-productivity zones.
- Irrigation canals and water storage facilities: Placed according to optimal terrain flow and soil stability.
The goal is to ensure that infrastructure sits on the most suitable ground, maximizing investment returns and minimizing maintenance costs.
6. Multi-Criteria Suitability Analysis (MCSA) for Rural Planning
While single-layer classification (like just mapping NDVI) is useful, the most powerful insights come from Multi-Criteria Suitability Analysis (MCSA). This is the process where we use GIS to mimic the real-world, complex decision-making of an expert planner.
6.1. Combine Multiple Rasters
An MCSA model for something like “New Rice Paddy Suitability” doesn’t look at one factor; it looks at a whole set of constraints and opportunities. We mathematically combine multiple raster layers into a single, comprehensive suitability index. This may include layers for:
- Soil fertility (Must be at least ‘Medium’)
- Slope (Must be <5 degrees)
- Water availability (Must be within 500m of a river or canal)
- Infrastructure access (Must be within 2km of a main road)
- Market proximity (Must be within 10km of a central market)
6.2. Weighted Overlay
The critical step in MCSA is the Weighted Overlay. It is not just about adding the layers together; it is about deciding which factor, in the context of the specific goal, matters the most. This is where the planner’s expertise is encoded into the model.
We assign a predefined weight (a percentage of importance) to each parameter based on its perceived impact on the final decision:
- Example: Site selection for a new farm.
- Soil Fertility: 40% (A non-negotiable factor)
- Slope: 25% (Steepness is costly to mitigate)
- Water Access: 20% (Manageable if expensive, but essential)
- Rainfall: 15% (Less critical if irrigation is available)
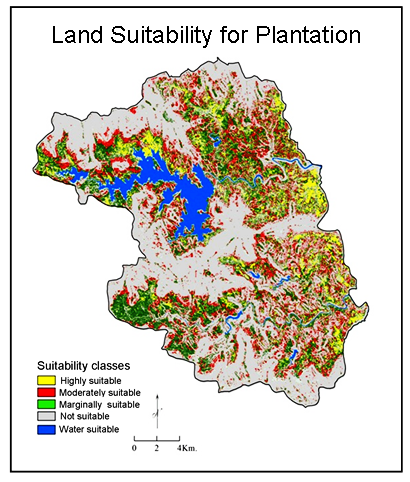
The GIS then calculates the final suitability score for every pixel by multiplying the pixel value of each input by its weight and summing the results. The final classified land is categorized into clear suitability zones:
- High suitability (e.g., 80%–100% score)
- Medium suitability (60%–80% score)
- Low suitability (40%–60% score)
- Unsuitable (<40% score)
6.3. Deliverables
The ultimate outputs are simple for the user, but rich in data:
- Suitability heatmaps showing a gradient of potential.
- Index maps for comparison across regions.
- Priority development zones guiding investment.
- Crop/land recommendations for specific locations.
These deliverables form the core of reports presented to ministers, investors, and community leaders.
7. How to Create a Land Classification Map (Step-by-Step Guide)
Creating a professional-grade land classification map is a structured project lifecycle that demands precision at every stage.
Step 1 — Collect & Preprocess Data: This is the data engineering phase. We acquire the raw data (satellite images, DEMs, etc.), ensure they are all in the same coordinate system, apply cloud masks to eliminate bad data, and use techniques like resampling to make sure all pixels are the same size. Index values like NDVI are often normalized to a standard range.
Step 2 — Choose Classification Method: Based on the project scale, budget, and required accuracy, we select the appropriate method, usually Supervised Classification using machine learning for high-accuracy agricultural projects, or Rule-Based for suitability analysis.
Step 3 — Run Classification in GIS: The computation phase, executed using professional-grade tools:
- ArcGIS Pro / QGIS (desktop software)
- SNAP (specifically for Sentinel imagery)
- Google Earth Engine (for large-scale, cloud-based processing)
- Python libraries (Rasterio, GDAL, Sklearn) for automated scripting.
Step 4 — Accuracy Assessment: A classification map is meaningless without validation. We use ground-truth data (GPS points collected in the field or derived from ultra-high-resolution imagery) to check the map’s accuracy.
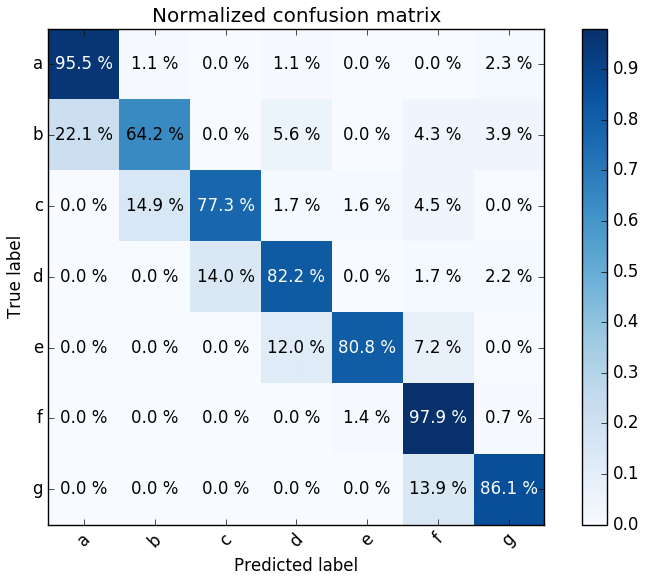
The standard professional metrics we report are:
- Confusion Matrix: A table summarizing correct vs. incorrect classifications.
- Producer & User accuracy: Measures of omission and commission errors.
- Kappa Coefficient: A robust statistical measure of agreement between the map and the ground-truth data. We aim for an overall accuracy above 85%.
Step 5 — Final Map Export: The final map is an executive-ready communication tool. We ensure it includes a clear legend, a classified, logical colour scheme, scale bar, and all supporting metadata so that the client knows exactly when and how the map was created.
8. Common Mistakes in Land Classification (and How to Avoid Them)
After years of reviewing countless classification projects, we can identify a few recurring pitfalls that undermine the entire effort. Our advice is cautionary and direct:
- Using low-quality or cloudy imagery: Never rely on imagery without performing a thorough cloud and shadow mask. A shadow patch can easily be misclassified as a water body or a specific crop.
- Ignoring slope and terrain effect: A common trap is classifying land based only on satellite imagery and ignoring the DEM. A flat area with low NDVI might be bare soil, but a high-slope area with low NDVI is an erosion risk; the classification must reflect the different risk levels.
- Too few training samples: If you are using Supervised Classification, your model is only as good as the samples you provide. Using only 10 samples for “Wheat” across a huge territory is insufficient. Collect hundreds of diverse, high-confidence samples.
- Misusing NDVI thresholds: Setting a single, rigid NDVI threshold (e.g., >0.4 is healthy) can be misleading. A healthy forest has a much higher threshold than a healthy dryland pasture. The thresholds must be context specific.
- Not validating results with field visits: The final check is always on the ground. A Confusion Matrix may give you an 85% score, but a quick trip to the field can reveal a systematic error (e.g., misclassifying bare ground with a specific spectral signature as urban area).
- Ignoring seasonal differences in imagery: Land cover can change dramatically between the wet and dry seasons. Agricultural maps must use imagery captured during the peak growing season for the most accurate classification.
9. FAQ: Land Classification & Raster Maps
What is land classification in GIS?
It is the process of grouping every pixel of a landscape into meaningful, predefined types such as cropland, forest, grassland, water bodies, or urban/built-up areas, based on measurable characteristics.
What data is needed for agricultural land classification?
The core datasets are high-quality Satellite images, a DEM (for terrain), detailed soil data, climate data, and calculated vegetation indices like NDVI for accurate land classification.
Which classification methods are used?
We use Supervised (machine learning-driven), Unsupervised (computer-clustering), Threshold, and Rule-based classification methods.
How accurate is NDVI for crop health?
NDVI is very effective as a proxy for photosynthetic activity and stress when used with season-appropriate imagery and validated with ground-truth data.
Which tools are best?
Professional work relies on ArcGIS Pro, QGIS, SNAP, Google Earth Engine, and scripting languages like Python.
How often should land maps be updated?
For agriculture, maps should be updated every season. For large-scale land cover or forestry changes, yearly updates are sufficient. For flood maps, updates are necessary after major hydrological events or infrastructure changes.
10. Why Work with GIS Specialists for Land Classification
The difference between a basic, publicly available map and a professional, high-accuracy Raster Classification Map is the difference between a rough estimate and a guarantee. You are not just hiring a cartographer; you are engaging an expert who is an essential risk manager and efficiency booster.
GIS professionals provide the expertise to:
- Ensure High-Accuracy Mapping: Utilizing advanced, machine-learning based Supervised Classification that accounts for local spectral variations.
- Perform Multi-Source Data Integration: Seamlessly combining complex soil, climate, and terrain layers into a single, cohesive model.
- Conduct Field Validation: Backing up every classification score with statistical rigor using the Confusion Matrix and field-based truth data.
- Build Custom Suitability Models: Creating goal-specific Multi-Criteria Suitability Analysis that directly encodes your priorities—whether that’s maximum yield or minimum environmental impact.
- Generate Professional Reports: Delivering clear, actionable reports for planners, investors, and ministries that meet the highest standards of evidence-based decision-making.
In the complex, high-risk world of rural development and modern farming, you cannot afford to base multi-million-dollar decisions on outdated or inaccurate data. Our goal is to replace uncertainty with classified, validated, geometric truth.
Book a consultation for agricultural and rural GIS planning.
Let us transform your raw land into a powerful, actionable roadmap for success.
📞 Schedule a Call | 📩 Email Us | 💼 Contact Us