When you’re choosing a site for a store, a clinic, or even a housing project, distance can be misleading. What truly matters is time. A location that looks “close” may, in practice, be out of reach.
Think about this: in the UK, the average commute time in 2023 was just under an hour, according to the Office for National Statistics. In Greater London, even a journey of only 8–10 miles often takes 45 minutes or longer during rush hour. Compare that to rural areas, where the same distance might take 12 minutes. The gap is huge, and decisions made without considering it often result in failure.
This is where isochrone maps provide clarity. They don’t just draw a circle around a site; they reveal the actual areas people can reach within a given time. Whether it’s a 15-minute drive, a 10-minute walk, or a 30-minute bus ride, isochrone maps help organisations plan with real accessibility in mind.
By the end, you will see how time-based mapping supports better decisions and why it should be part of your next project.
What is an Isochrone Map?
The word “isochrone” is derived from Greek roots: iso (meaning “equal”) and chronos (meaning “time”). Put simply, it’s a map that connects all the points reachable within a set travel time from a starting location.
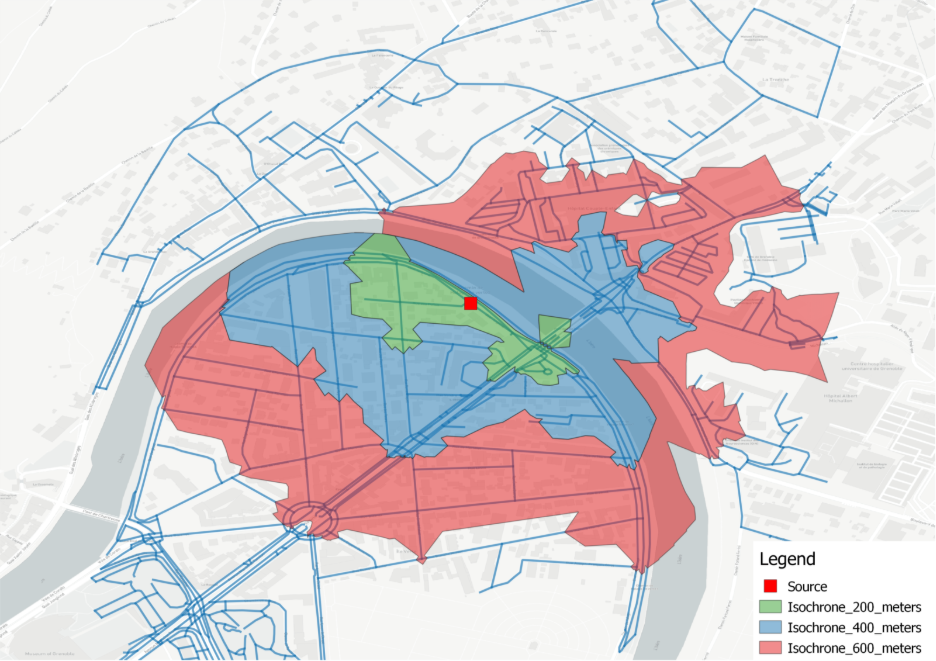
Instead of a neat circle, the boundary appears irregular, bending along roads, shrinking at bottlenecks, and stretching where high-speed routes are present. It reflects reality rather than theory.
Isochrone vs Radius
- Radius map: a circle, drawn using distance. A 5-mile buffer looks the same in every direction.
- Isochrone map: shaped by real conditions. Five miles north might be 8 minutes by car, while five miles east could take 25 minutes in traffic.
In one UK study, a council found that only 62% of households within a 5-mile radius of a GP clinic could actually reach it within 15 minutes by car. The rest were cut off by rivers, rail lines, and limited roads.
How Isochrone Maps Are Built
- Travel Time Intervals: Often shown in increments of 10, 20, or 30 minutes.
- Modes of Travel: Driving, cycling, walking, or public transport. Some maps combine them.
- Data sources include road networks (e.g., Ordnance Survey, OpenStreetMap), traffic models, and public transport timetables.
- Outputs: Colour-shaded polygons or GIS layers (GeoJSON, shapefiles) that can be analysed with population or income data.
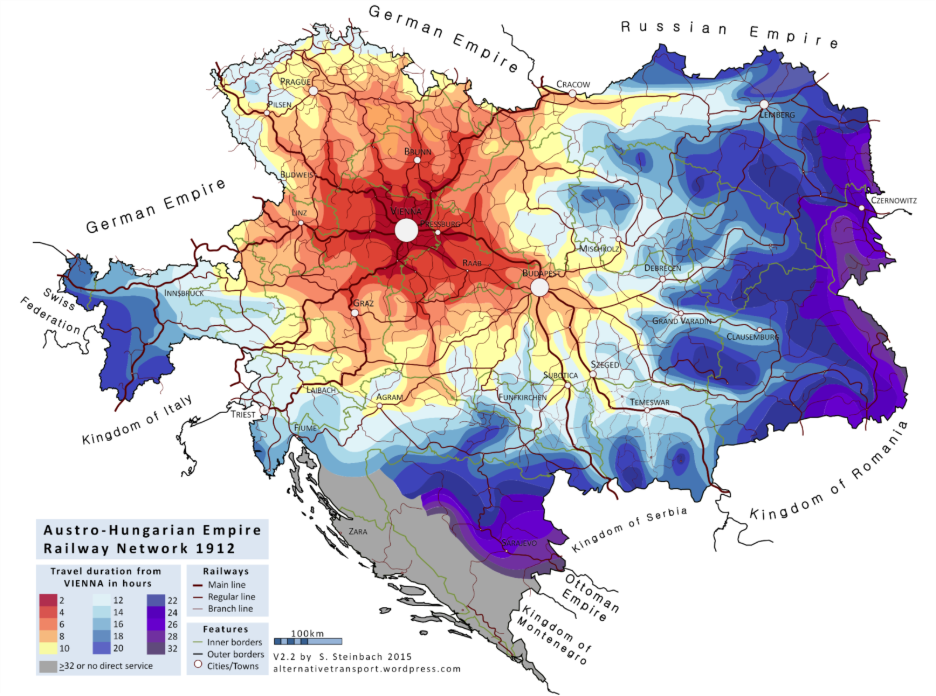
A Note on History
Isochrones are not new. Rail companies in the 1800s produced printed maps showing how far a passenger could travel in one hour from a station. The shapes were crude, but the concept was identical. Today’s digital versions are faster, richer, and accurate to the minute.
Applications of Isochrone Maps in Different Sectors
Accessibility affects everything from profits to public safety. Here’s how different sectors apply isochrone analysis.
1. Retail and Commercial Planning
Catchment area is everything. Retailers use isochrone maps to see how many potential customers fall within a reasonable travel time.
- Supermarkets look at 10-, 20-, and 30-minute drive zones to estimate household coverage.
- Quick-service restaurants often focus on serving within 5–10 minutes, as repeat visits depend on convenience.
- Luxury stores overlay income data to target wealthier neighbourhoods within 15 minutes.
A well-known UK supermarket reportedly abandoned a proposed site after isochrone analysis revealed only 40% of its target market could realistically reach it within 15 minutes. The “perfect-looking” site would have underperformed.
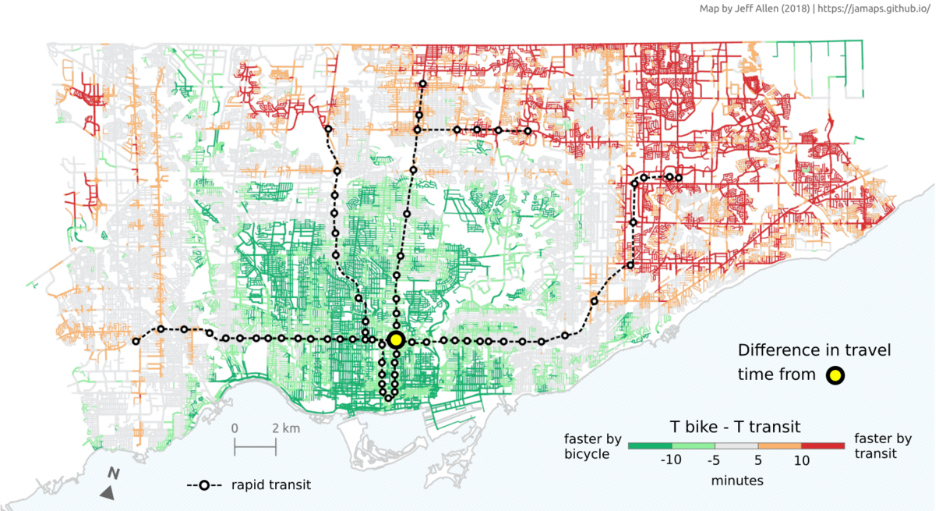
2. Transport and Urban Planning
Local governments use isochrones to measure public access to transport. Transport for London, for instance, publishes maps showing how quickly people can reach different parts of the city by Tube or bus.
In Manchester, planners mapped 30-minute bus access zones to assess whether low-income areas had sufficient access to jobs. The results revealed “public transport deserts” in communities outside any 30-minute access band. Those findings shaped where new routes were funded.
3. Emergency Services
Response time is a matter of life and death.
- The NHS in England sets a 7-minute average response target for Category 1 calls (life-threatening emergencies).
- Fire brigades often plan around an 8-minute target for reaching incidents.
Isochrone maps show which areas fall inside or outside these limits. When a new housing estate is built, emergency services use isochrones to test whether an additional station or unit is needed.
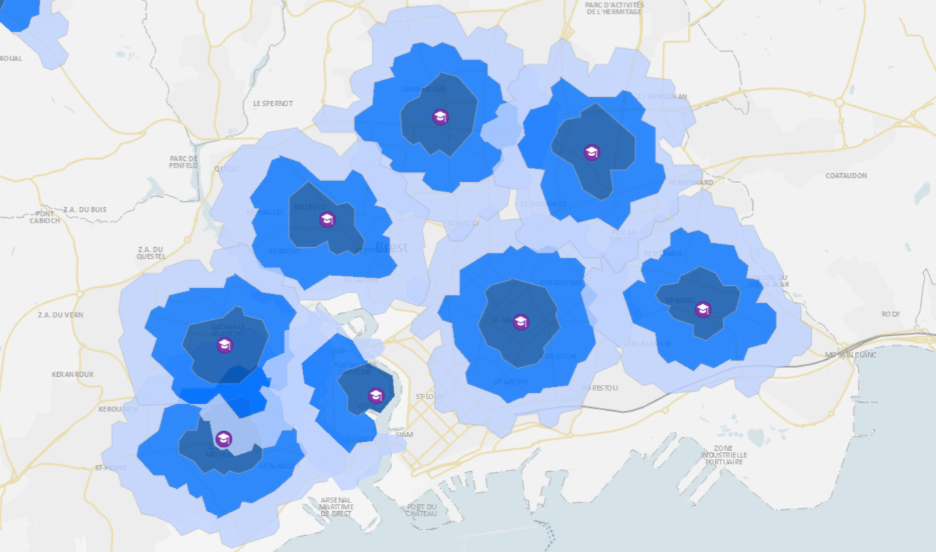
4. Healthcare
Access to care is a global concern.
- In rural Scotland, health authorities mapped 30-minute driving isochrones around hospitals. They discovered that 14% of the population lived outside these zones, which guided the deployment of mobile clinics.
- In the US, isochrone maps are used to identify “healthcare deserts”, places where residents cannot reach essential care in under 30 minutes.
For private providers, isochrones also help prove demand. A new dental practice in Birmingham used a 15-minute drive isochrone to show that 25,000 residents lacked local services strengthening their business case.
5. Real Estate and Development
Developers increasingly use isochrones in planning submissions. A residential scheme near a railway station can enhance its attractiveness by highlighting the number of jobs accessible within a 30-minute commute.
Commercial landlords highlight accessibility to reassure investors. If an office building is within a 20-minute public transport zone for half the city’s workforce, it has a strong marketing edge.
6. Logistics and Delivery
Parcel and food delivery companies depend on isochrone analysis. A depot covering 50,000 households within 20 minutes is efficient; one covering 20,000 is not.
Amazon, for instance, bases its “Prime same-day” promises on isochrone models to ensure its depots can realistically serve target zones.
Free Tools vs Professional Isochrone Maps
There are plenty of free isochrone generators online. They’re great for exploration but not for high-stakes decisions.
Free Tools
- Smappen — quick maps but limited accuracy.
- Mapbox Isochrone API — suitable for developers but needs coding.
- TravelTime offers web tools and an API, with limitations in the free tier.
Limitations include:
- Simplified data (often ignores traffic conditions).
- Caps on the number of sites or queries.
- Limited transport modes.
- No integration with demographic or commercial data.
Professional Services
Professional isochrone mapping offers:
- Higher Accuracy: Local datasets, real traffic patterns, and validated public transport timetables.
- Customisation: Ability to run “what if” scenarios, overlay demographics, and test multiple modes.
- Deliverables: GIS files, reports, and visuals suited for planning or board presentations.
- Support: Interpretation and expert advice alongside the maps.
Think of free tools as sketches. Useful to explore an idea, but when you need solid numbers for an investment decision, professional analysis is the safe choice.
How Much Do Isochrone Maps Cost?
There’s no single price. Costs depend on:
- Size of the study area.
- Number of sites.
- Modes of transport analysed.
- Time intervals used.
- Whether demographic overlays are required.
Example Scenarios:
Single-Site, Simple Project
- One site, accessible by car only, 10-20 minutes away.
- Entry-level, affordable.
Retail Chain Comparison
- Multiple candidate sites, driving plus public transport.
- Demographic overlays to estimate the customer base.
- Mid-tier pricing.
Regional Study
- Entire city or region, multi-mode, multiple intervals.
- Full reporting for government or corporate board.
- Higher tier.
Subscription APIs
Mapbox, TravelTime, and Geoapify offer APIs. Costs are usually per request or via monthly subscriptions. These are cost-effective for developers but require in-house technical skills.
Consultancy Approach
At GIS Navigator, each project is quoted individually. The focus is on value, not just cost. By avoiding poor site choices or planning missteps, isochrone analysis saves far more than it costs.
Isochrone Maps in Action: Case Studies
Retail
A supermarket chain weighed two sites. Isochrone analysis revealed that Site A’s 15-minute drive zone included 60,000 households. Site B covered only 38,000. The evidence saved them from investing in the wrong location.
Public Services
A Midlands council mapped access to leisure centres. The results showed two suburbs fell outside the 20-minute travel zones. Funding was secured for a new centre, improving equity in service provision.
Healthcare
A clinic in Leeds tested patient access. Isochrones confirmed that 82% of its target population could reach the site in 30 minutes by bus. This evidence was included in the planning application, helping secure approval.
Logistics
A delivery company found that its depot served only 60% of high-demand areas within a 15-minute timeframe. By relocating 5 miles east, coverage jumped to 90%. Fleet efficiency rose, and delivery times dropped.
Education
A county authority analysed school access. Isochrone maps showed several villages outside the 30-minute zone for secondary schools. Bus routes were redesigned to improve equity.
Why Work With GIS Navigator?
Working with GIS Navigator means you’re not just buying a map. You’re getting analysis backed by years of expertise in GIS and planning.
Our Method
- Understand your needs — schedule a scoping call to identify your goals.
- Use the right data — official road networks, transport schedules, and traffic models.
- Analyse carefully — using professional GIS software, not shortcuts.
- Deliver clearly — shapefiles, maps, and reports in plain language.
- Support decisions — working with your team to apply results.
Why Clients Choose Us
- Experienced professionals
- Transparent quotations, no hidden fees.
- Flexible outputs tailored to planning, investment, or operations.
- Focus on accuracy and practicality, not jargon.
If you’re planning a project where accessibility matters, whether it’s in retail, healthcare, housing, or public services, isochrone mapping can provide the evidence you need.
Get in touch with GIS Navigator today. We’ll prepare a tailored quotation and provide results you can rely on.