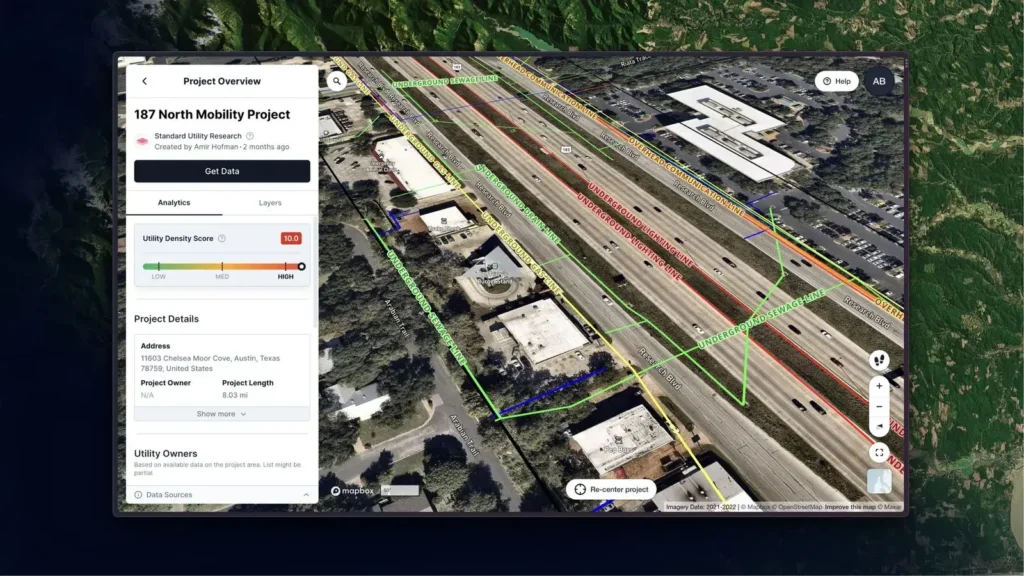
People once printed maps, folded them, and scribbled notes like “new road” or “closed shop.” Now the map updates itself. Flood alerts appear before water hits the street, and new boundaries show up overnight after planning approval.
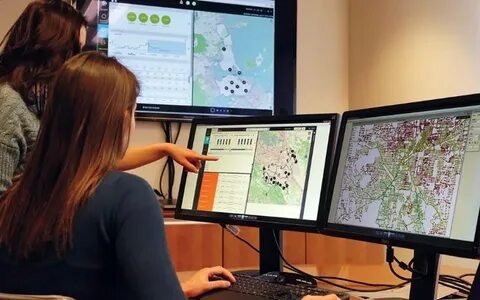
Most users don’t think about it, they just drag the map and it works. The data isn’t on one laptop anymore; it’s online, ready for anyone with access. A planner in Leeds, an engineer in Bristol, and a surveyor elsewhere can all view the same live layer at once.
Today, Web GIS runs quietly behind many UK maps used by councils, utilities, and transport teams. It’s no longer a novelty, it’s part of daily work.
What is Web GIS?
When people hear Web GIS, it sounds technical, but it’s really simple. It means keeping map data online so everyone can view and update it at the same time. No special software, no long waits for new files, just open a browser and the map is ready.
Think of the old way: one file on one computer, sent around whenever someone made changes. Now, edits appear live for everyone.
On the front end, you’ll see tools like ArcGIS Online, Mapbox, or Leaflet. Behind them, servers quietly manage the layers and keep things working without you noticing. Most teams use cloud platforms such as AWS or Azure, so storage and updates happen automatically.
With Web GIS, the planner, surveyor, and manager all see the same map. It keeps projects simple, accurate, and quick to manage.
Evolution: From Paper to Dashboards
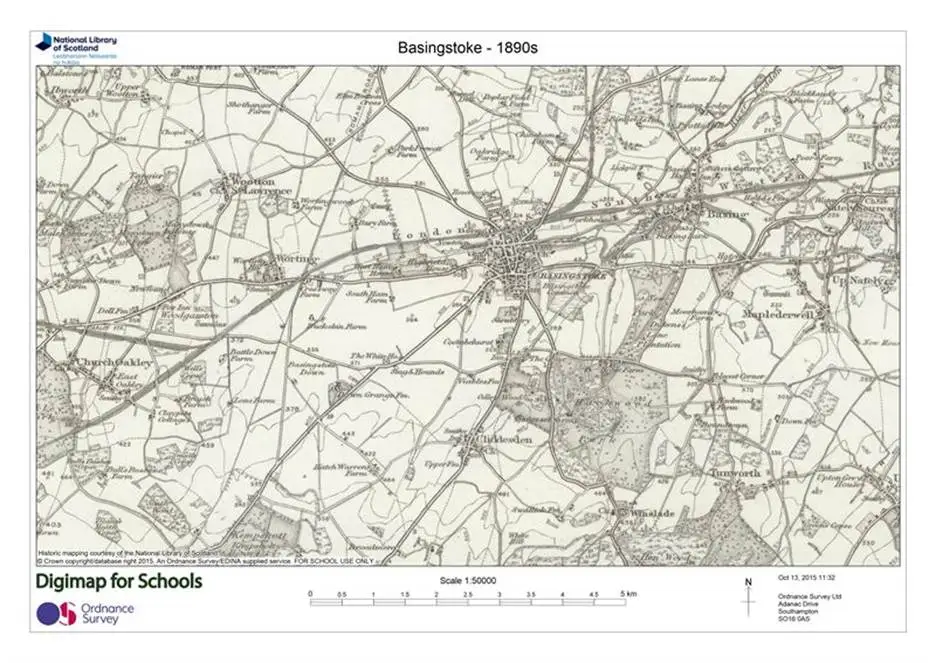
It helps to step back for a moment. Every modern map we see online is part of a long chain of changes, and each one starts with something printed on paper.
Back then, the maps were static. You drew them, printed them, and hoped they stayed relevant for a few years. When something changed, a road extended, a river shifted, a new estate appeared, a whole new edition had to be drawn. It was precise work, but painfully slow.
Then came the desktop GIS, which changed everything. Suddenly, maps could be updated digitally. You could measure, overlay, or even calculate distances without redrawing anything. But there was still one limitation: the data stayed on a single computer. Whoever owned that workstation controlled the latest version.
As the internet matured, cloud GIS arrived. It allowed people to upload and share spatial data more freely. You could finally store large datasets in one place and let different teams access them. Still, something was missing, the live element. That’s what Web GIS added.
Today, Web GIS sits at the centre of how maps are made and shared. It’s not just a tool for cartographers anymore. A planner can check policy boundaries; a council can monitor flood risk; a developer can explore transport links, all through a single web dashboard.

In the UK, a few major moments pushed this evolution forward:
- Ordnance Survey OpenData and later the OS Data Hub made national basemaps available for open use.
- Defra’s Data Services Platform opened thousands of environmental layers, everything from biodiversity to flood zones, for public access.
- The UK Geospatial Commission’s Strategy 2030 turned location data into national infrastructure, promoting open standards and interoperability.
Those changes made spatial data part of everyday decision-making. Today, Web GIS dashboards are everywhere, inside council offices, utilities, universities, and private firms. They replaced long reports and static diagrams with maps that anyone can explore and update in seconds.
If paper maps were the first language of geography, Web GIS is its fluent conversation, quick, connected, and shared by everyone who needs it.
Bring your maps online with Web GIS that works across teams with the help of GIS Navigator.
Move from static files to shared dashboards built for accuracy and speed.
📞 Schedule a Call | 📩 Email Us | 💼 Get a Quote Now
How Web GIS Works?
Every web map is a conversation between your browser and a server somewhere. The browser keeps asking, “show me this area,” and the server sends back the right pieces, tiles, layers, or data features. That exchange happens again as you move around the map, so quickly that it feels instant.
A few short terms describe how those exchanges work:
- WMS sends flat map images.
- WMTS chops those images into tiny tiles, so they load faster.
- WFS shares live vector data that you can measure, query, or even edit.
- OGC APIs do roughly the same job but in a lighter, cleaner way. They’re designed, so web apps don’t get weighed down with complex code. Nothing flashy, just faster, simpler communication.

Most of the mapping data is held within spatial databases, PostGIS, ArcGIS Enterprise, or Oracle Spatial, systems designed to manage and maintain reliable geographic records. Each one keeps things tidy and consistent; every boundary, line, and feature stored right where it should be. So, when a building outline appears on screen, it isn’t estimated or drawn by eye. It comes straight from the real record sitting on the server.
When analysis is needed, maybe a flood buffer, route check, or accessibility study, the heavy work happens on the server or in the cloud. Many UK teams now run their GIS tasks on AWS, Azure, or Esri’s managed cloud because those platforms scale automatically. Add users, and the system just stretches to fit without anyone touching a setting.
Security runs through the entire setup. Log-ins control access and roles, while encryption protects information as it moves between users. Any data tied to people or specific locations is handled under UK GDPR, clear, simple, and strict.
At the surface, you’ve got the tools people touch, Leaflet, Mapbox GL JS, ArcGIS Experience Builder, and a few others. These are what users interact with day to day: filters, pop-ups, and dashboards that make the whole thing feel approachable instead of complex.
Next time you move a map across your screen, take a second. Beneath that calm image, servers, databases, and cloud systems are constantly talking to one another, swapping small packets of data fast enough that you never notice. That invisible coordination is what makes Web GIS reliable, and quietly brilliant.
Need a map that updates itself?
At GIS Navigator we design secure, cloud-based Web GIS systems so your team always works from the latest data.
📞 Schedule a Call | 📩 Email Us | 💼 Get a Quote Now
Key Components of a Web GIS
When you open a map online, it looks simple. Click, zoom, done.
But under that surface, several bits are working together. Each one has its own job. Miss one and the whole thing starts to wobble.
1. Spatial Databases
Everything begins here. PostGIS, ArcGIS Enterprise, Oracle Spatial, whichever tool is used, this is where the data lives. Every boundary, road, and building record sits in these tables. They keep order, stop duplication, and remember who changed what. It’s the quiet layer that makes the rest of the map trustworthy.
2. Map Servers
Next is the part that builds what you see. The server pulls data from storage and turns it into something viewable. Each time you pan across the map or type a postcode, it’s fetching small pieces and redrawing them almost instantly. Without that constant redraw, you’d just be staring at a blank grid.
3. Web Services and APIs
You’ll sometimes see names such as WMS, WFS, and WMTS. These describe how your web browser and the server share map data during use. The process runs constantly in the background, quietly refreshing information so the map feels current and quick to react.
4. Cloud Infrastructure
Most of this now runs in the cloud, AWS, Azure, or Esri Cloud. The choice hardly matters. What matters is flexibility. More users log in, it stretches. Work slows down, it shrinks. No one has to touch a server or worry about storage limits.
5. Client Applications
People usually notice this part first because it’s what they can actually move and use. The map you click or zoom around on, that’s it. Working behind that map are tools like Leaflet, Mapbox GL JS, and ArcGIS Experience Builder. They decide how things appear on the screen and take care of small tasks, for instance, showing filters or opening pop-ups when you click around. All that gives the map shape and meaning, even though most of the hard work is happening quietly in the background.
6. Security and Permissions
And finally, control. Who’s allowed to look? Who’s allowed to edit? That’s handled through log-ins and encryption. Data that links to people or addresses is kept within UK GDPR rules. It’s not optional; it’s part of responsible mapping.
When all these layers work together, Web GIS feels natural and immediate. Move the map, and it reacts almost at once. It’s solid, reliable, and clear, the background work happens quietly so users can focus on what really matters.
Applications Across UK Industries
Across the UK, Web GIS has become part of everyday work. You’ll find it in council offices, on job sites, and behind planning decisions that shape communities. It’s no longer a specialist tool, it’s something many professionals rely on to understand places and make decisions that matter.
Each sector uses it differently. Councils use Web GIS to track public data, engineers follow progress on live maps, and planners manage updates to planning layers. “But in the end, they’re all working toward the same thing, making sure location data stays up to date and practical for whoever needs it.”
1. Government and Smart Cities
Local authorities now make far more information public than before.

In London, the London Datastore lets residents browse live maps covering projects, pollution levels, and approved developments. Birmingham and Manchester have similar platforms where people can check planning proposals or view traffic and maintenance updates.
When maps stay current, everyone works faster. There’s less waiting for updates and fewer meetings to clarify details. It also builds trust between councils and residents, since people can see changes as they happen.
Read More: GIS in Government
2. Environment and Climate
Departments like DEFRA and the Environment Agency rely on Web GIS for their day-to-day work, from flood forecasting to tracking conservation zones.
The MAGIC Map remains one of the most well-known examples, combining hundreds of environmental datasets into a single interactive source.
Rather than searching through files or reports, a planner can check a location in seconds. That convenience has turned what used to be a slow process into a quick, confident task.
Read More: Applications of GIS in Environmental Management
3. Transport and Mobility
Transport teams treat Web GIS as a real-time dashboard.

Transport for London uses it to monitor live traffic and planned works.
Councils apply the same setup to track bus routes, cycle lanes, and areas with poor access to public transport.
It’s less about maps and more about awareness, a clear picture of how people move through a city at any given moment.
4. Real Estate and Urban Planning
Architects and developers use Web GIS to simplify coordination.
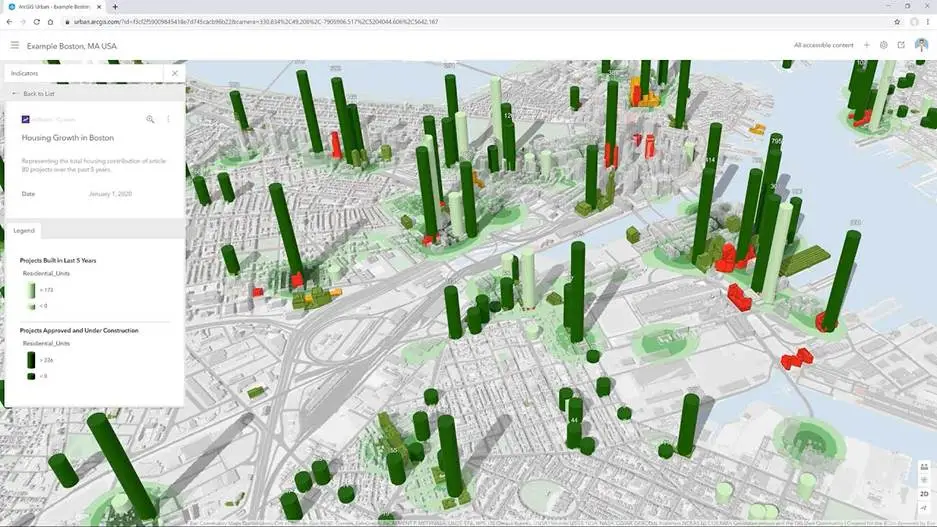
Boundaries, flood zones, and topographic data appear together on one screen. That single view cuts down on calls and email threads.
When something changes, say, a planning boundary or a land constraint, the update appears automatically.
For larger schemes, this small improvement saves days of revision work and keeps teams aligned from the start.
5. Energy and Utilities
Utility and energy firms depend on Web GIS to oversee assets across wide areas.
It maps networks such as power lines, gas systems, and underground services, all accessible through a secure web platform.
“Whether they’re in the office or out on-site, everyone works off the same live map. That simple change cuts down mistakes and saves a lot of rework.”
“For renewable energy, it also helps map where new projects like wind farms or solar parks connect to the grid, supporting faster and clearer investment decisions.”
Explore More: GIS for Telecommunications Utilities
6. Health and Emergency Services
In healthcare and emergency planning, Web GIS plays a quiet but vital role. It shows where communities lack quick access to clinics or hospitals, helping planners identify service gaps.
Emergency teams use the same mapping to improve ambulance coverage, manage response zones, and analyse real-time demand.
By bringing all this information together, Web GIS helps services respond faster and allocate resources where they’re most needed.
Read More: Role of GIS in Healthcare Industry
Whatever your sector; planning, energy, or environment, Web GIS keeps decisions clear.
Let us show you how live mapping can simplify your daily work by GIS Navigator.
📞 Schedule a Call | 📩 Email Us | 💼 Get a Quote Now
Benefits of Web GIS
Web GIS has changed how maps fit into daily work. Instead of sitting on one machine, they now live online where anyone can open them, explore, and make updates together. That small shift has made mapping more practical for every type of project.
The first clear gain is accessibility. A planner adjusts a boundary in the office, and field teams see it straight away. Everyone works from the same version, which cuts down on errors and saves time.
It also adds speed and order. Layers refresh on their own, and maps link directly to live data. Tasks that used to take hours, exporting, printing, sharing, now finish in minutes.
Because the data stays current, decisions come faster. Councils track road changes in real time. Developers can check layouts as they evolve. No one waits for updates or wonders which plan is the latest.
There’s a cost benefit too. Less software to install, fewer paper plans to print, and no servers to maintain. It’s lighter on budgets and easier to scale.
And finally, Web GIS builds team connection. Staff in different offices, or even countries, see the same live map. It keeps work open, visible, and easy to follow.
Web GIS in the UK: Case Studies and Success Stories
Across the UK, Web GIS has become part of everyday work. Councils check maps online, planners view updates in real time, and engineers share data without sending files back and forth. It sits quietly behind decisions that shape roads, housing, and public spaces.
1. Ordnance Survey – Open Data for Everyone
Ordnance Survey has been central to mapping in Britain for generations. Its OS Data Hub now makes those maps live. Users stream basemaps straight into their apps or pull the data they need. Local authorities, energy firms, and small tech teams use it daily to trace boundaries or plan new services. There’s no local setup, just clear, ready-to-use layers.
2. Environment Agency – Flood Map for Planning

If you need to check flood risk in the UK, this map is usually the first thing people open. Type in a postcode and up come the nearby rivers, flood zones, and places known to flood. Councils use it when reviewing planning applications. Developers often check it early on to understand how drainage or flood resilience might affect a site before starting any work.
3. Natural England – The MAGIC Map

The MAGIC Map, run by Natural England, brings a lot of environmental information into one simple online view. It shows where habitats and protected land sit, along with countryside stewardship areas. You can open it straight in a browser, no setup or download needed. Many people use it day to day, from students and researchers to farmers checking their fields.
4. Transport for London – Journey Planner and Live Data

Transport for London’s Journey Planner brings live data and mapping together. It helps users plan trips, avoid delays, and see accessibility routes in real time. The same feeds are open to developers, who build their own travel apps from them. It’s an example of Web GIS working in the background of everyday life.
Tools and platforms leading the way
Behind most Web GIS projects are a few dependable tools keeping maps live and data flowing. In the UK, teams usually mix commercial and open-source options depending on what they need. No two setups look exactly the same, each system has its own way of handling, displaying, or sharing spatial data online.
1. Commercial Platforms
A. ArcGIS Online and ArcGIS Enterprise
Esri’s mapping tools have become the everyday standard across much of the UK. Councils use them to share planning data, engineers track site work, and utilities keep an eye on underground assets. Dashboards and reports can be built straight into the platform, while the Experience Builder helps teams design map pages without needing any coding.
B. Mapbox GL JS and CARTO
These are often used when appearance and usability matter most. Developers use them to build modern-looking maps that are both lightweight and flexible. They’re especially useful for public-facing websites or mobile-friendly mapping.
C. Google Maps API
Still one of the simplest tools to get started with. Many companies pick it for its stability and ease of setup. It’s not the most advanced GIS platform, but it works well when a project needs clear basemaps or quick location features.
2. Open-Source and Hybrid Options
A. Leaflet and OpenLayers
Leaflet and OpenLayers are free mapping tools that many web developers use to add interactive maps to their sites. They work on almost any website with very little setup. Many people prefer Leaflet for smaller projects, it loads quickly, looks neat, and doesn’t need much technical effort to get running.
B. GeoServer and PostGIS
GeoServer and PostGIS handle the heavy lifting behind most open GIS setups. GeoServer deals with online map layers and sharing services like WMS and WFS. PostGIS turns a normal database into one that understands spatial information. When used together, they give teams more freedom to manage updates and host their own data instead of relying on external platforms.
C. QGIS Server and Deck.gl
QGIS Server publishes QGIS projects as online maps, while Deck.gl is designed for large data visualisation, such as transport routes or environmental change. These tools often appear in research projects and open-data platforms.
-> Most Famous Tools in UK
You’ll find a mix of these tools in use everywhere, from national projects managed by Esri UK, AtkinsRéalis, and GeoPlace, to small local portals run by district councils. Some combine ArcGIS for secure data, PostGIS for analysis, and Leaflet for the public view. It’s a flexible setup that keeps costs low while maintaining full control over information.
Choosing the right GIS stack can save time and cost.
We help organisations pick and configure the best tools for their mapping goals at GIS Navigator.
📞 Schedule a Call | 📩 Email Us | 💼 Get a Quote Now
Challenges and limitations
- Data security and privacy: Every Web GIS project in the UK must follow GDPR from the start, with clear guidance on access, storage, and audit processes.
- Offline use: Because maps depend on the internet, it’s sensible to plan a way for field teams to keep working when the signal drops.
- Cloud dependency and performance: Choose a stable host. Split large datasets into smaller sections or use caching so maps load smoothly.
- Browser compatibility and responsive design: Test your map on several devices before sharing it. It should display well on phones, tablets, and desktop screens. Keep it light, quick to load, and make sure it follows WCAG 2.1 AA standards so it’s accessible to all users.
- Standards and interoperability: Follow OGC standards and use the latest APIs that most mapping tools already support. This keeps your maps open, easy to connect with other systems, and simple to maintain over time.
- Continuous updates: Assign clear ownership for each dataset and enable automatic updates so the information remains reliable.
Future Trends in the UK
Across the UK, mapping has quietly become part of how day-to-day work gets done. The next stage is about joining information together, not inventing new systems. Local councils, surveyors, and infrastructure firms are beginning to use one shared view of location data so that everyone sees the same facts at the same time.
Public bodies continue to widen access to government-held mapping. The Geospatial Commission and Ordnance Survey now release more live datasets that others can build on. This shift lets smaller councils, consultants, and planners use accurate data without having to manage large servers or buy expensive software.
Private firms are following the same path. Most new mapping projects now sit on cloud platforms where several teams can log in, make updates, and check results instantly. When changes appear in real time, delays and duplicated drawings fall away.
Web GIS is also changing how progress is reviewed. Instead of sending files back and forth, teams use live dashboards to track land use, transport works, or energy projects. Every adjustment shows on screen within seconds, turning maps into working tools rather than reports to be filed later.
Web GIS has moved beyond being a niche or technical tool. It now serves as a simple, reliable way to keep information updated across planning, construction, and environmental work in the UK. The systems themselves stay in the background, quietly supporting decisions and helping teams work with fewer delays.
How to Build a Web GIS System (step-by-step)
- Define purpose & audience.
Internal ops dashboard? Public planning map? Customer-facing locator?
- Collect and clean data
Start with authoritative basemaps and addressing (OS, GeoPlace UPRNs) plus departmental layers (planning, assets, environment).
- Choose a stack
SaaS: ArcGIS Online for speed to value.
OpenStack: PostGIS + GeoServer + Leaflet/MapLibre.
Hybrid: ArcGIS Enterprise in AWS/Azure.
- Publish services
Use WMS/WMTS for map images and WFS/OGC API – Features for editable/queryable features.
- Design the interface
Keep layer lists short. Write plain-English pop-ups. Add filters and a clear legend. Provide export or print.
- Test performance
Tile heavy layers (WMTS). Use scale-dependent visibility and cache searches.
- Governance, security, compliance
Roles, groups, and audit logs. Add an accessibility statement where required. Follow UK GDPR.
- Deploy & monitor
Add uptime monitoring and analytics: schedule data refresh and user reviews.
Ready to build a Web GIS that delivers real-time clarity?
Our team at GIS Navigator can plan, develop, and deploy a secure system tailored to your organisation.
📞 Schedule a Call | 📩 Email Us | 💼 Get a Quote Now
Conclusion:
The UK’s mapping landscape has undergone significant changes. We have moved from static files on a single PC to interactive web maps and dashboards that support daily work across councils, utilities, health, transport, and property. National strategies and open data policies keep the momentum going, and modern standards (OGC APIs) make systems easier to connect.
If your team wants to publish clear, reliable, and interactive maps for internal decision-making or public services, Web GIS is the practical route. Start small, pick a solid stack, and put usability first.
Ready to plan a Web GIS or dashboard?
GIS Navigator can scope your use case, recommend a stack, build a secure web app, and hand over a maintainable workflow. Contact us today!