Every supply chain manager knows that logistics problems rarely show up neatly in a spreadsheet. Delays happen on the road, at the port, or in the warehouse yard and by the time they appear in a report, it’s already too late.
This is where GIS (Geographic Information Systems) is making a difference. It brings location into the centre of decision-making. Instead of simply tracking numbers, GIS shows where problems occur, why they matter, and how to fix them.
In today’s supply chains, pressured by rising costs, labour shortages, and unpredictable events, GIS is no longer a luxury. It has become an essential tool for visibility, resilience, and speed.
1. What Makes GIS Different in Logistics
Traditional logistics systems do a good job of processing transactions: when goods leave, when they arrive, when they’re signed off. What they lack is context. They tell you what happened, not where or why.
GIS adds that missing layer. It links deliveries, inventories, and routes to geography. This allows managers to ask questions that static systems can’t answer:
- Which customers are consistently affected by late deliveries?
- How do weather and traffic combine to slow down certain routes?
- Where should new depots be placed to reduce average delivery times?
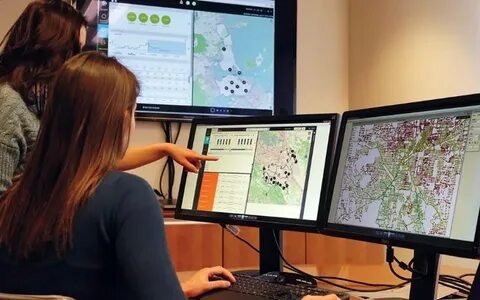
Picture a distribution manager in Manchester, UK rerouting deliveries after the M60 is hit by heavy congestion. With GIS, they can overlay live traffic feeds, weather warnings, and driver locations on a single map. Instead of waiting for delays to build up, they adjust schedules in real time, avoiding costs and customer frustration.
2. Real-World Benefits
Route Optimisation & Cost Savings
Fuel and time are the two biggest drains in transport. GIS allows companies to analyse journeys in detail, highlighting where vehicles idle, overlap, or detour unnecessarily.
Take the M62 corridor in the North of England: haulage firms found that repeated bottlenecks were eating into driver hours. By using GIS to model alternative routes and adjust departure times, they cut travel delays by 15% and saved thousands of pounds in fuel each quarter. That kind of practical optimisation isn’t guesswork; it comes from seeing the supply chain spatially.
Risk & Disruption Management
Logistics networks are vulnerable to events far beyond a manager’s control: floods, strikes, or sudden port closures. GIS helps identify which routes, hubs, or suppliers are at risk before disruption hits.
For example, when flooding affected parts of Yorkshire in 2022, supply chains with GIS overlays of flood-prone zones were able to reroute deliveries days in advance. Instead of scrambling after the event, they had already mapped backup options and kept goods moving.
Warehouse & Hub Placement

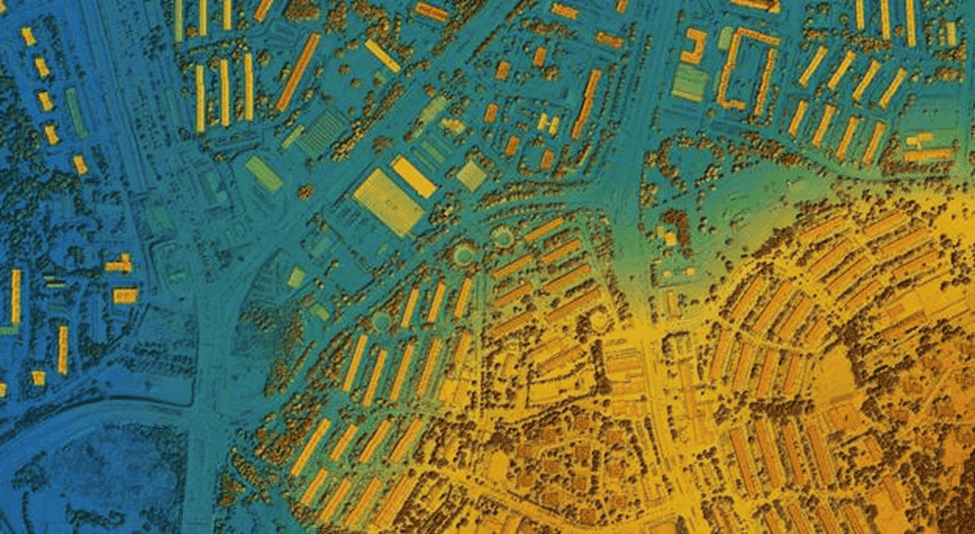
The decision to place a warehouse or cross-dock facility can shape costs for decades. GIS models bring clarity by analysing customer demand, travel distances, and infrastructure.
One UK retailer used GIS to test different warehouse locations before committing to a new site. The analysis showed that a Midlands hub would cut average delivery times by a third compared to their original plan near London. The move not only reduced mileage but also brought distribution closer to key regional markets.
3. Visibility, Inventory & Demand Matching
Full-Network Visibility
Most supply chains stretch across multiple partners and geographies. Without a common platform, information is scattered: drivers know one thing, warehouse teams another, managers something else.
GIS acts as the single source of truth. Everyone sees the same live map of goods in transit, stock levels, and potential delays. For executives, it provides an instant dashboard of where bottlenecks are forming. For operations teams, it provides the necessary details to fix them.
Inventory Allocation & Forecasting
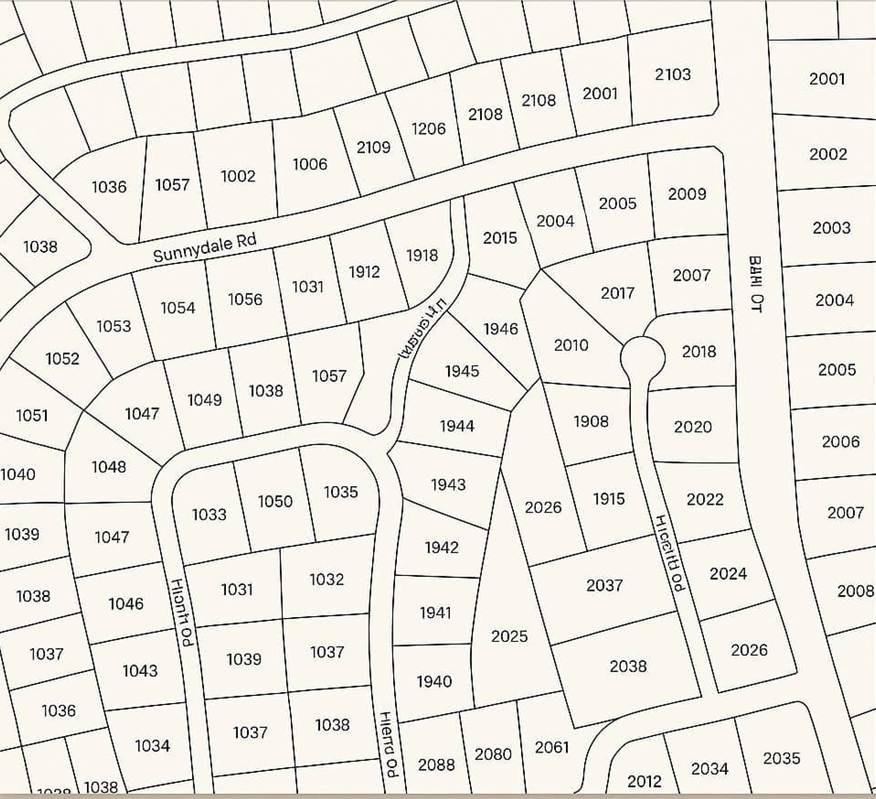
Stock imbalances are costly when concentrated in one place, while shortages occur in another. GIS prevents this by mapping inventory against demand clusters.
Consider a logistics provider serving both London and Birmingham. With GIS, they can see demand growing in the Midlands while warehouses in the South remain overstocked. Instead of waiting for shortages, they shift stock ahead of time, keeping service levels up while avoiding last-minute transport costs.
4. GIS in Broader Supply Chain Management
Supplier Network Mapping
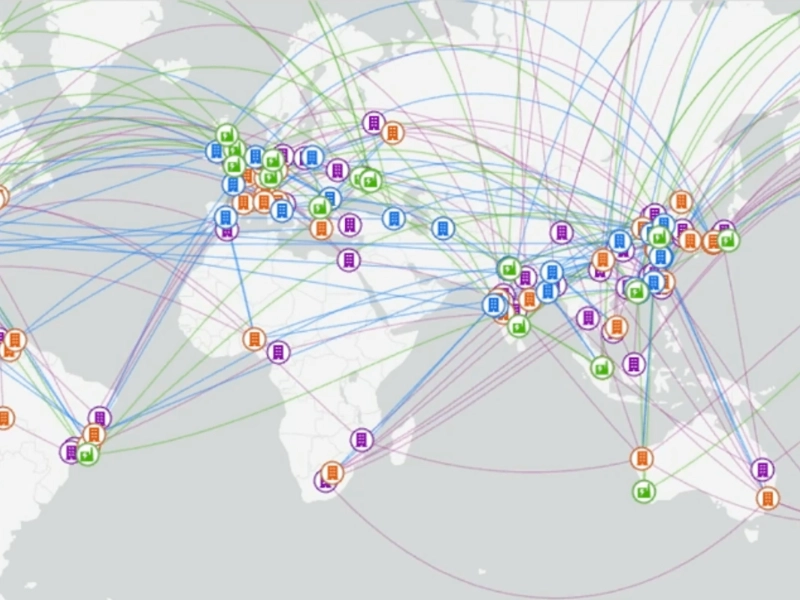
Supply chains depend on suppliers scattered across regions and countries. GIS helps map where those suppliers are, what risks they face, and how they connect into the network.
For a UK manufacturer sourcing parts from Europe, GIS might reveal that several critical suppliers are tied to Channel crossings. This visibility highlights the risk of disruption from port delays and helps identify alternative sources.
Demand-Supply Alignment
Customer demand rarely grows evenly. By overlaying sales data, stock levels, and transport routes, GIS shows where supply is falling behind. Retailers can rebalance stock between regions before shortages damage customer trust. For instance, shifting inventory north when online orders spike in Scotland.
Sustainability & Compliance
Environmental accountability is now central to supply chains. GIS tracks land use, transport emissions, and sourcing locations to prove compliance with sustainability rules. For UK firms, this includes DEFRA reporting and alignment with carbon reduction commitments. GIS offers verifiable evidence, helping companies stay ahead of regulators and auditors.
Finance & Insurance
Banks and insurers want proof of resilience. GIS can provide it by showing diversified supplier bases, mapped risks, and historic delivery performance. A farmer applying for crop insurance or a logistics company filing a claim for weather-related delays both gain credibility when they can back their case with geospatial data.
5. Challenges in Rolling Out GIS for Supply Chains
Adopting GIS is not without barriers.
- Integration: Existing ERP or transport systems need to work with GIS platforms, which takes planning.
- Data Sharing: A supply chain is only as transparent as its weakest link. If suppliers or hauliers refuse to share data, gaps remain.
- Skills & Costs: Smaller firms may see GIS as out of reach, lacking both technical teams and budget. Yet many start small, mapping routes or monitoring a single warehouse, and expand once benefits are proven.
The lesson is clear: GIS adoption is a journey. It doesn’t have to begin with a full-scale overhaul, but it should begin.
6. Conclusion
Logistics has always been about movement, but without location intelligence, much of it is blind movement. GIS changes that by making supply chains visible, measurable, and predictable.
From route optimisation on the M62 to planning warehouses in the Midlands, GIS is already shaping the way goods move in the UK and beyond. It turns logistics from reactive firefighting into proactive planning.
For supply chain leaders under pressure, GIS offers something rare: clarity. It shows not just where problems are, but how to fix them before costs rise and customers walk away.