Have you ever wondered how city planners decide where to build new roads or how conservationists track wildlife migration?
The answer lies in a powerful technology called Geographic Information Systems (GIS). Geographical information systems are revolutionizing how we understand and interact with our world, offering precise tools for managing and visualizing geographic data.
This blog will explore the fascinating history of GIS. So, join us to discover how GIS shapes our world, one map at a time.
How Can GIS Mapping Improve Your Decision-Making?
Turn complex data into clear insights with GIS. Explore solutions with GIS Navigator today!
📞 Schedule a Call | 📩 Email Us | 💼 Get a Quote Now
What is GIS?
GIS stands for Geographic Information System. It’s a computer-based tool used to capture, store, manage, analyse, and visualize geographic data. Essentially, it connects data to a map, allowing us to understand patterns, relationships, and spatial context.
Components of GIS
A GIS typically consists of several key components:
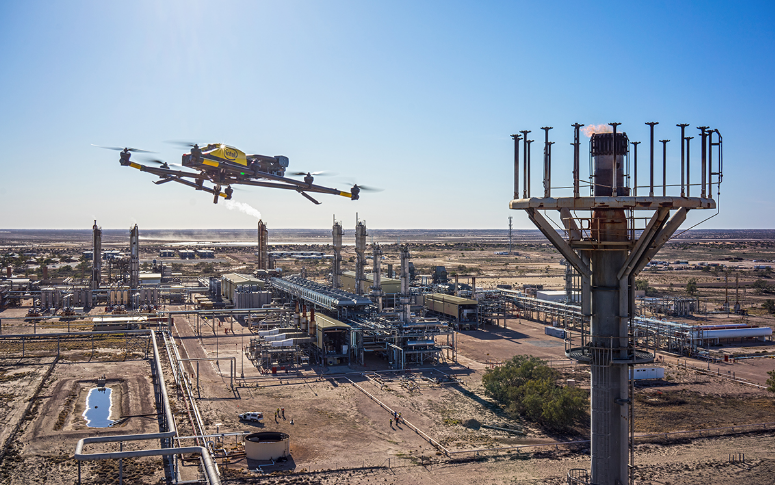
- Hardware includes computers, servers, GPS devices, drones, and other equipment used to collect and process data.
- Software is the heart of the GIS, including applications for data input, editing, analysis, visualization, and output.
- Data: The geographic information itself, such as maps, imagery, GPS coordinates, and attribute data (e.g., population, land use, elevation).
- People: The individuals who collect, manage, analyse, and interpret the data.
- Procedures: The workflows and methodologies used in the GIS process.
Basic Functionalities of GIS
GIS offers a wide range of functionalities, but some core capabilities include:
- Data capture: Collecting geographic data from various sources, including maps, aerial imagery, GPS, and field surveys.
- Data storage: Organizing and managing geographic data in a structured database.
- Data analysis: Performing spatial analysis to identify patterns, relationships, and trends in the data. This includes tasks like buffering, overlay analysis, and network analysis.
- Data visualization: Creating maps and other visual representations of geographic data to communicate information effectively.
- Data output: Producing various output formats, such as maps, reports, and charts.
What is GIS Used For?
Here are some important GIS examples in everyday life:
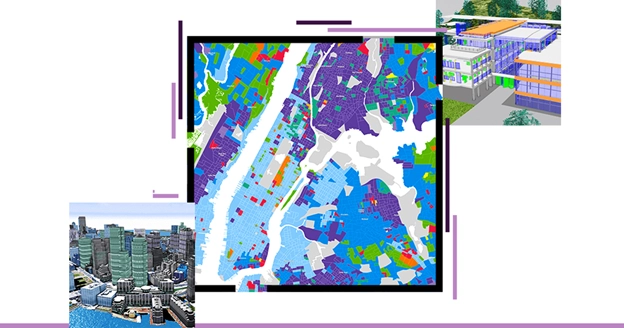
Mapping
GIS makes data visualization possible. For daily navigation, Google Maps is an excellent illustration of a web-based GIS mapping solution. However, innovative mapping has come a long way, and products like Nobel’s Geo Viewer—which provides cities, municipalities, and the private sector with a detailed view of the electric and water district assets in the field—use this technology.
GIS in Geography
Geologists use GIS data to evaluate seismic data, examine soil, and produce three-dimensional representations of geographical characteristics. Additionally, it can be used to assess the properties of rocks and determine which places are ideal for various purposes.
Construction Sector
GIS enhances planning, design, and management in the construction industry by providing detailed spatial data. It aids in site selection, urban planning, and environmental impact assessments.
GIS supports infrastructure management and risk analysis by identifying natural hazards and improving maintenance efficiency. It also integrates spatial data with project schedules, enhancing project management and decision-making.
Additionally, GIS facilitates better communication with stakeholders through visual project representations and helps preserve historical sites by mapping their locations relative to new construction. GIS planning boosts efficiency, accuracy, and sustainability in construction projects.
Need Accurate and Reliable Spatial Data?
GIS mapping helps you visualize, analyse, and act with confidence. Contact GIS Navigator to get started!
📞 Schedule a Call | 📩 Email Us | 💼 Get a Quote Now
Transportation Planning
Transportation issue management frequently uses GIS data. Businesses can plan new rail or road routes by incorporating environmental and topical data into a GIS platform.
Traffic Pattern Optimization
The timing of traffic lights can be improved for better traffic flow by using GIS software to analyse traffic patterns. When necessary, detours around construction zones can also be planned to use it. GIS can do way more than just this.
Wildlife
Conservation groups use GIS technology to keep an eye on protected properties.
- Wildlife migration patterns are tracked and observed using GPS and GIS.
- Vegetation mapping is frequently used to pinpoint potential animal locations as a stand-in for natural habitats.
- Digital elevation models provide the elevation and aspect, while imagery sources like Landsat and others offer vegetation indices that can be used to simulate wildlife habitats.
Telecom and Network Services
Businesses can use geographic data in their intricate network planning, optimization, design, and maintenance processes. This data improves telecom operations by improving customer relationship management and location services.
Urban Planning
GIS data is used to analyse urban growth and its trajectory. When used correctly, it can identify new locations for development, considering the various elements required for a building project to be completed successfully.
Enhance Your Urban Planning Projects through our GIS solutions can help you plan smarter
How does GIS work?
Data Collection
GIS relies on accurate and comprehensive data to function effectively. This data is gathered through a variety of methods. GPS technology provides precise location coordinates, allowing for the collection of spatial data in real-time. Remote sensing, utilizing satellites and aircraft, captures images of the Earth’s surface, which can be processed to extract valuable information about land cover, vegetation, and other features. Ground surveys involve physical measurements and observations to collect detailed data on specific locations. Additionally, existing data from various sources, such as census records, topographic maps, and historical documents, can be incorporated into GIS systems.
Data Storage and Management
Once collected, geographic data needs to be organized and stored efficiently for easy access and analysis. GIS software employs sophisticated database systems to manage this information. Data is typically stored in layers, each representing a specific type of information, such as roads, land use, or elevation. This layered approach allows for flexible analysis and visualization. Metadata, which describes the characteristics and quality of the data, is essential for ensuring data integrity and understanding its limitations.
Data Analysis and Visualization
GIS offers a powerful suite of tools for analysing spatial relationships and patterns. By overlaying different data layers, analysts can identify correlations and trends. For example, analysing the proximity of schools to areas with high population density can inform school planning. GIS also enables complex spatial queries, such as determining the shortest route between two points or identifying areas at risk from natural hazards. Visualization is a key component of GIS, as maps and other visual representations effectively communicate complex spatial information. GIS software provides tools to create various map types, including thematic maps, choropleth maps, and cartograms, to highlight specific features or patterns.
Types of GIS
The type of GIS mapping used depends on what needs to be visualized. Examples can include crop categorization and population density. The most popular GIS map types are bubble, amount, heat, cluster, and category.
Category Maps
A category GIS map is the best option when you need to know precisely which areas of the map match which data segment. Due to its ease of creation, this is one of the most popular forms of GIS mapping. A unique colour is assigned to a specific category or property. The product is a handy map with patches of various colours, each signifying a distinct category.

Heat Maps
The term “GIS heat map,” frequently misused to refer to quantity maps, refers to a particular mapping convention. Having a rough notion of “warmer” and “cooler” regions can be helpful when dealing with highly dense and inconsistent data to display on the map, mainly if you know that the hot regions correspond to the quantity’s highest density.
Red is generally understood to represent heat, and blue to represent cold. While it may not be highly accurate, it does offer a general idea of the distribution of quantities.

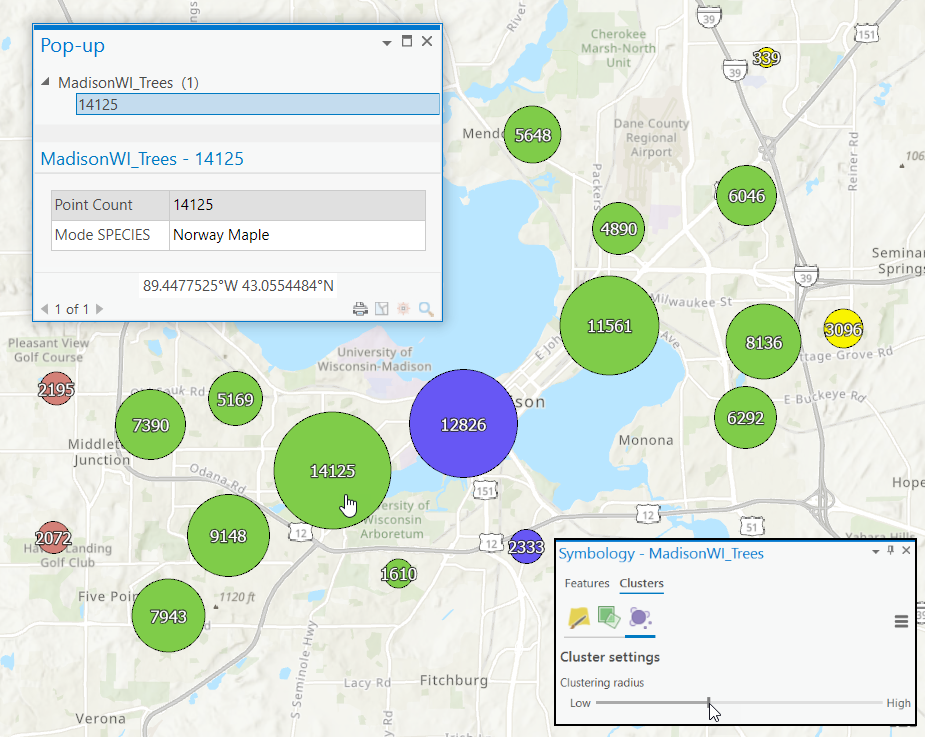
Cluster Maps
This kind of clustering effectively combines labels, colours, and shapes to group closely spaced data points. In other words, because there are too many points to show separately on the GIS map, they are conveniently combined into a single cluster point.
Bubble Maps
A sphere, A GIS map illustrates how to make the arrangement of intricate numerical data simpler by utilising forms and size differences. Consider the scenario where you must compare the frequency of specific slang terms used in various areas. More extensive and smaller bubbles on the GIS map will represent more and fewer people. You receive bubbles in place of monotonous rows and columns of numbers. This saves time and effort by giving a rapid basic knowledge of the link between numbers and locations immediately.

Quantity Maps
A GIS quantity map is color-coded; however, different tones of the same colour indicate the variation in the quantities of items shown on the map. It is the ideal GIS mapping solution for visualising intricate data dispersed over a wide area.

Advantages of GIS
The benefits of using a geographic information system include:
Cost Saving
GIS services accurately map project schedules, timeframes, workforce, and resource requirements. GIS systems may assist us in eliminating the unknown while performing any company process by providing precise projections, options, and likely outcomes even before a project is started.
Emergency Response and Disaster Management
GIS is a crucial tool for disaster management and emergency response. First responders can swiftly assess the situation and decide on the best course of action using GIS, which provides real-time information about the location and scope of a disaster.
For instance, it can include details on the impacted areas, such as the locations of vulnerable populations, vital infrastructure, and possible escape routes during a natural disaster like a hurricane or earthquake.
A timely and effective response might then be planned to utilize this information.
Preparation is critical to lowering risks and minimizing losses. A leading provider of geospatial analytics, Geoapify helps companies remain ahead of the curve in preparedness and catastrophe management.
Better Decision-Making
Like other information systems, GIS supports better decision-making by providing data querying, analysis, and mapping tools. It aids decision-making processes, such as planning inquiries, mediating territorial disputes, and positioning infrastructure to minimize visual impact. GIS can help select locations for new home additions that are environmentally friendly, low-risk, and near population centers. By presenting data clearly through maps and reports, GIS allows decision-makers to focus on critical issues and analyze multiple scenarios efficiently.
Improve Organizational Integration
According to many organizations that have used one, one of the critical advantages of a GIS is better management of internal resources and operations. GISs make interdepartmental information exchange and communication more accessible by linking data sets based on geography. A shared database will enable departments to collaborate on projects, collect data once, and use it repeatedly.
With increased communication between individuals and departments, redundancy decreases, productivity rises, and overall organizational efficiency improves. As a result, a utility provider can link its infrastructure and customer databases to send computer-generated letters to impacted customers during planned repair.
Improve Environmental Management
GIS in environmental management has proven invaluable. It gives us a platform to store, process, and display environmental data, which enables us to understand better how human activity affects the environment and to make decisions that will lessen that impact.
GIS can analyse the distribution and amount of deforestation, a significant cause of climate change. Monitoring changes in forest cover over time can assist us in identifying regions that are vulnerable to deforestation and preventing it.
Simple Examples of GIS
Here are a few simple examples of GIS:
Mapping a Local Park
GIS can be a valuable tool for managing and improving local parks. By creating a detailed map of a park, GIS can help identify various features such as trails, picnic areas, playgrounds, and bodies of water. It can also be used to measure distances, calculate the area of different sections, and analyse the distribution of trees or other vegetation. This information can be used to plan park improvements, such as creating new trails, upgrading facilities, or managing wildlife habitats.
Tracking Delivery Routes
GIS plays a crucial role in optimizing delivery routes. By inputting information about delivery locations, traffic patterns, and road conditions, GIS can generate the most efficient routes for delivery vehicles. This can help businesses save time and fuel, reduce costs, and improve customer satisfaction. Additionally, GIS can be used to monitor delivery progress in real time, allowing for efficient route adjustments based on changing conditions.
Future of GIS
Geospatial data will become more detailed and accessible with the help of automation, cloud computing, drones, and Internet of Things (IoT)- connected devices. A vital new feature that virtual reality (VR) introduces is the ability for users to move around and interact with geographical data in novel and fascinating ways.
Furthermore, as scalable foundational models for analysing all kinds of data from remote sensors are developed, the incorporation of artificial intelligence (AI) is growing. Users can access answers to queries on topics, such as invasive species, deforestation, and responding to natural disasters. You can read more about IBM and NASA’s partnership here.
Ready to See GIS Mapping in Action?
Discover how our GIS solutions can streamline your projects. Let’s discuss your needs today!
📞 Schedule a Call | 📩 Email Us | 💼 Get a Quote Now
Conclusion
The transformative power of GIS technology cannot be overstated. It has become an indispensable tool that transcends traditional methods, enabling more informed decisions, fostering collaboration, and driving innovation across diverse fields.
From enhancing the precision of urban planning to revolutionizing environmental conservation, GIS has proven its versatility and value.
As we progress, the continued integration of GIS with emerging technologies like AI, VR, and IoT promises even more incredible advancements.
Embracing GIS equips us with the tools to better understand and interact with our world. It empowers us to address the complex challenges of the future with greater clarity and confidence. The potential for GIS is boundless, and its impact on our lives will only continue to grow, shaping a more connected and intelligent world.
To learn more about GIS, visit our website, GIS Navigator.