Let’s face it crime doesn’t happen in a vacuum. It happens somewhere. And that “where” often holds the key to solving it, or even stopping it before it begins.
That’s where GIS in law enforcement comes in helping police departments analyze, plan, and act based on spatial data.
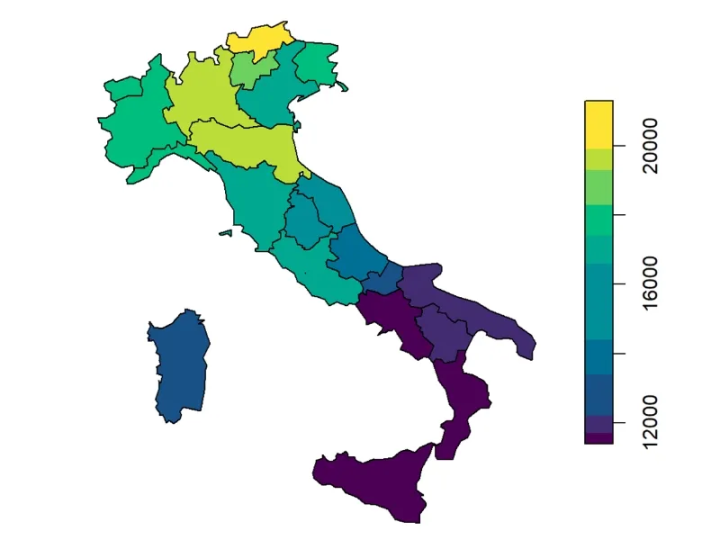
Instead of combing through stacks of reports, law enforcement teams can now look at the bigger picture literally. Maps filled with location data, crime reports, and even demographic overlays help officers make better decisions, faster.
This blog breaks down how crime mapping works, and how GIS tools are changing the way police tackle public safety.
What Do We Mean by Crime Mapping?
You hear the term thrown around a lot, but what is crime mapping, really?
In simple terms: it’s placing crimes on a map. But not just any map. It’s layered with all sorts of context schools nearby, lighting conditions, transit access, and even population changes.
What you get is a full picture, not just dots on a screen.
And this isn’t new. Crime mapping tools started appearing back in the ’80s and ’90s. But today’s versions are way more advanced handling live data, flagging hotspots, and even spotting patterns that officers might miss.
Modern crime mapping using GIS allows agencies to overlay environmental, social, and criminal activity data for deeper analysis and faster response strategies.
1. Spotting the Trouble Zones
Not all neighbourhoods see the same problems. Some areas get hit over and over and not by chance.
That’s why police use hot spot analysis. It shows where things are heating up. Maybe it’s a corner with lots of car break-ins. Or a stretch of road that sees fights every weekend. GIS tools take that data and highlight those areas before the next call comes in.
It’s not about reacting. It’s about staying one step ahead.
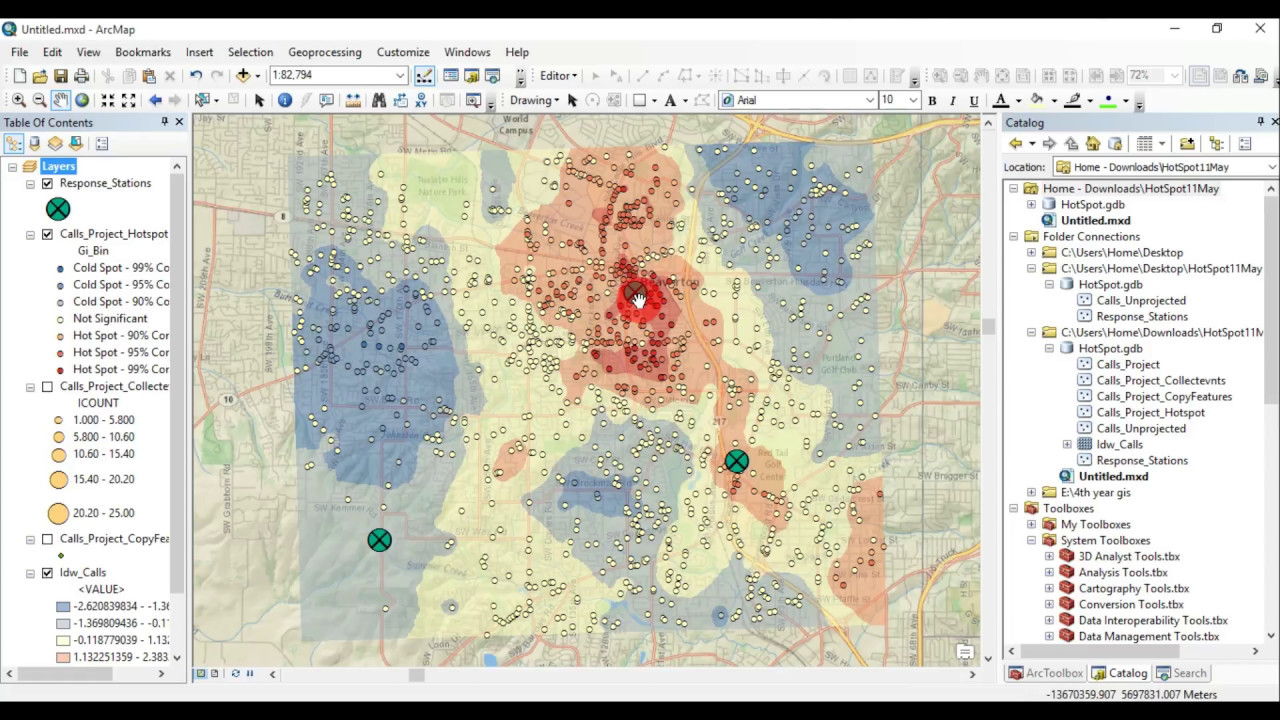
GIS tools take that data and highlight those areas before the next call comes in the essence of crime mapping using GIS to proactively reduce risk.
2. Smarter Use of People and Time
Police departments don’t have unlimited officers. So, how do they decide where to send them?
That’s where GIS helps. If thefts are happening near transit stations after dark, patrols can shift their focus. If noise complaints are piling up in one zone, maybe foot patrols get assigned there.
It’s about matching resources with need not guesses.
3. Helping Investigators Connect the Dots
Not every crime scene hands over the full story. Often, it’s about piecing things together figuring out if separate incidents are somehow linked.
GIS helps with that.
Let’s say a few break-ins happen within a few blocks, around the same time each week. On paper, those might look like random cases. But put them on a map? Suddenly, there’s a pattern. Maybe it’s someone local. Maybe it’s tied to a bus route or an alley with no cameras.
Investigators can pull in other data calls, past arrests, even mobile phone activity to build stronger leads. It’s not magic. It’s just seeing what’s already there, more clearly.

4. Predicting What’s Coming Next
This part is big. Instead of always reacting to crimes, police can use GIS to predict where the next ones might happen.
How? By layering past trends with real-world conditions. Things like poor lighting, abandoned properties, or sudden shifts in population often point to areas at risk.
In one city, they noticed a drop in burglaries after rolling out this approach. Officers adjusted their patrols before problems escalated. And it worked.
Sure, no model gets it right every time. But having an early warning system? That changes the game.
5. Keeping the Public in the Loop
People want to know what’s happening around them. And they should.
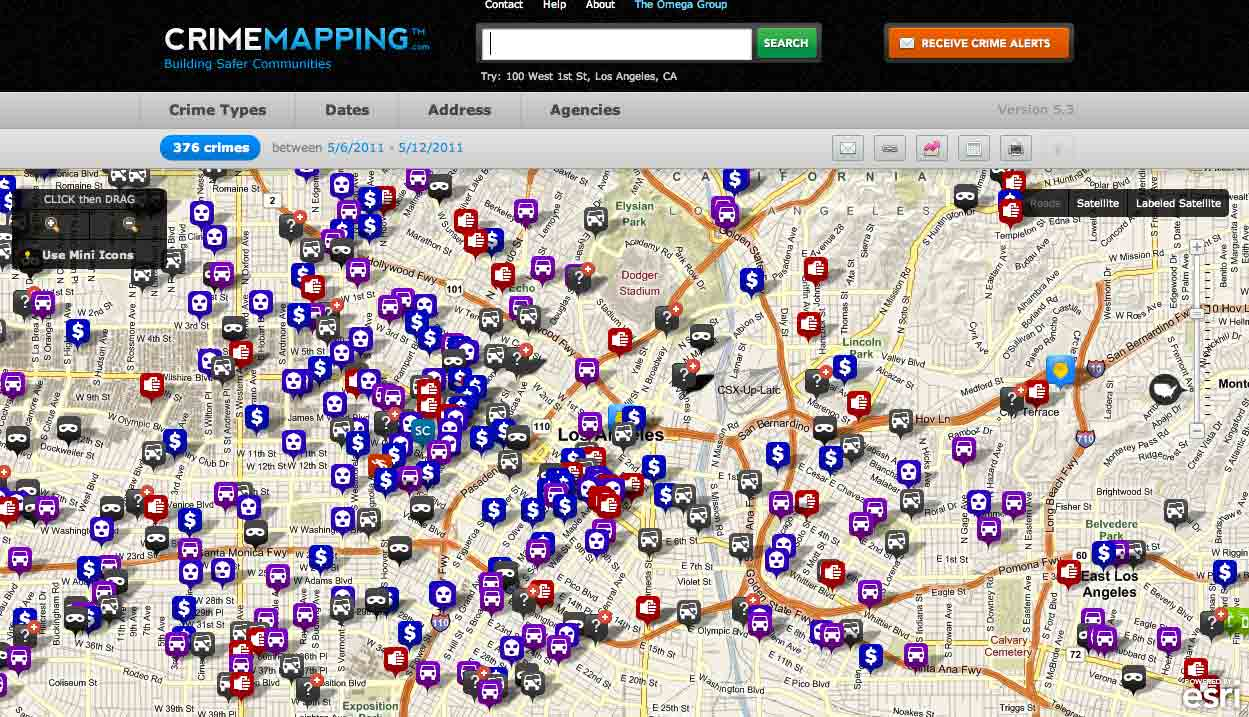
Many departments now share interactive crime maps online. These aren’t just static reports they let you zoom in on your street, check recent activity, and even filter by time or type of crime.
For communities, this builds trust. It says: “Here’s what we know, and we want you to know it too.”
Schools use the data to review safety plans. Businesses use it to plan store hours or install cameras. And residents? They just feel a little more in control.
What’s New in Crime Mapping?
AI Is Getting Involved
Some cities are now experimenting with AI and satellite images to predict crime-prone areas. Early tests showed surprising accuracy nearly 80% in some places. While it’s still being refined, the potential is clear: technology is giving law enforcement a wider lens.
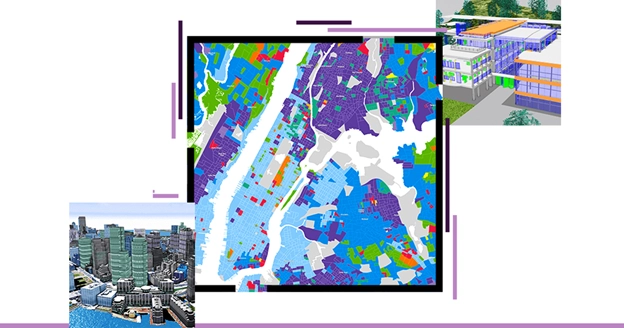
Real-Time Feeds on One Map
Imagine a single map showing live 911 calls, surveillance camera views, and patrol routes all updating instantly. Cities like New York are already there. It helps officers make faster choices during emergencies or fast-moving incidents.
Focused Policing with Better Outcomes
In Pittsburgh, GIS-guided patrols helped lower violent crime without unfairly targeting any one group. That matters. It shows that data, when used right, can support both safety and fairness.
Real Stories from the Field
- CrimeView has helped agencies across the world. In one case, it even helped track a repeat offender by connecting multiple locations in Virginia Beach.
- Baltimore County Police used GIS to cut both crime and traffic accidents by identifying overlap in high-risk areas.
- San Bernardino County monitors registered offenders and their proximity to schools using GIS buffers helping keep community standards in check.
These aren’t theories they’re working examples.
Why It Actually Works
It Puts Officers Where They’re Needed
Instead of driving in circles or relying on outdated maps, patrols go where patterns say they’re most effective.
Response Time Gets Better
When dispatchers know traffic patterns and incident clusters, they send help the fastest way. No more zig-zagging across town.
It Strengthens Investigations
Seeing crimes on a map especially with added data often uncovers links that paperwork alone can’t show.
It Helps Stop Crime Early
If the data shows trouble brewing in one part of town, police can step in sooner sometimes preventing incidents altogether.
It Builds Public Trust
When people can check crime maps themselves, they feel informed. That makes community policing more of a partnership.
Teams Work Better Together
GIS helps more than just the police. Fire services, EMS, even local planners use the same maps for better coordination especially during city-wide events or emergencies.
It Proves Accountability
In today’s climate, police departments need to show how decisions are made. GIS logs everything from patrol paths to crime response making it easier to share results with oversight boards and the public.
What’s the Catch?
Well, like any tech, GIS has its challenges.
- Privacy needs constant attention. Predictive tools should never cross into surveillance overreach.
- Bad data leads to bad decisions. If reports aren’t entered accurately, maps won’t tell the right story.
- Training is a must. These tools only work if people know how to use them.
- Ethics matter. Data should never replace human judgment. Oversight, clear rules, and checks are vital.
What GIS Navigator Brings to the Table
This isn’t just off-the-shelf software. GIS Navigator builds systems with law enforcement in mind:
- We clean, format, and layer your existing data from CAD to RMS.
- We develop custom mapping tools, whether you want hotspot tracking or predictive alerts.
- We build dashboards that officers, supervisors, and city partners can actually use.
- We offer training, ethical checks, and long-term support.
- We help different agencies use the same tools without stepping on each other’s toes.
Everything’s designed to make your maps work in the real world.
Conclusion
Policing is under the spotlight. Every action is questioned and rightly so. That’s why smarter tools like GIS matter.
They don’t replace good officers. They support them. They help departments do more with less, react quicker, and earn community trust.
In a time where results matter, GIS in law enforcement is proving to be a vital solution for smarter policing, crime reduction, and public accountability.
GIS Navigator is already working with agencies that want to lead, not lag behind. If your team’s ready to take crime mapping to the next level, we’re ready to help.