Geographical Information System (GIS) finds their usage in a wide array of applications such as disaster management, urban planning, environmental management, and transportation. GIS serves these applications through data. The two primary types of data used in GIS application are vector and raster with each having distinct set of characteristic and applications.
In this blog, our experts will provide you a quick peep into the GIS data types, differences, and advantages. So, stay with us!
Struggling to Choose the Right GIS Data Format?
Let GIS Navigator help you determine whether vector or raster data best suits your project.
📞 Schedule a Call | 📩 Email Us | 💼 Get a Quote Now
Understanding GIS Data Types
Speaking precisely, GIS data represents spatial information and attributes of geographical features. The visualization, analysis, and interpretation of this data help GIS experts to decipher the relationships, patterns, and trends of a given space. Vector and raster are two key types of data. However, they represent the aforesaid information in different ways; we’ll explain it in the later stage. First, let’s find out what these types actually are:
1. Vector Data
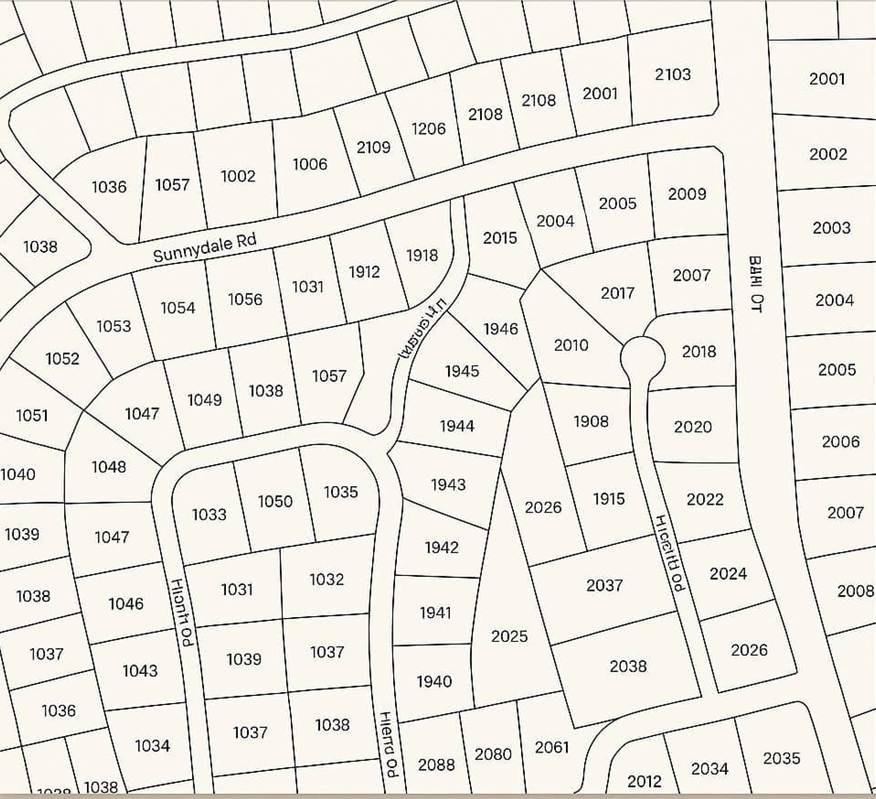
Such representation of the world that involves points, lines, and polygons is called vector data in the GIS. This data is created by digitizing the base data and is used mostly in cases where you need to represent discrete objects such as buildings, roads, and political boundaries. One of the biggest advantages of vector data is that it is highly precise with the ability of storing a wide range of attribute information.
Now that you have acquired a good understanding of vector data, let’s explore its components.
Geometries of Vector Data
The first geometry of vector data are points. These points represent a single location and has a pair of coordinates that define its position. In GIS, experts usually use points to represent location of features such as wells, schools and trees.
The second geometry of vector data is line (these are also called polylines so don’t get confused when these terms are used alternatively). They are a series of connected points that represent linear features. In GIS, experts use lines to depict features such as rivers, roads, and pipelines. Furthermore, the two most notable properties of lines are length.
The third and the last geometry of vector dataset is polygons. When connected lines form a closed shape, they give birth to polygons. GIS experts use them to represent parks, lakes, and property boundaries. The two most notable properties of polygons are area and perimeter.
Advantages of Vector Data
Vector data offers a range of advantages to experts. The first and the foremost is precision. By accurately capturing the shapes and boundaries, it provides high precision in geographic features. The second advantage of the vector data is that it has the ability to store rich attribute information against each feature; this allows you to perform detailed analysis and querying.
When it comes to occupying the storage space, vector data has proven to be more efficient that the raster data. This is specifically helpful when you are representing the discrete features.
Vector data is used to map and analyze urban infrastructure, zoning, and land use. Likewise, roads, railways, and routes are effectively represented and analysed using vector data.
Now let’s move to the raster data to develop a better understanding.
2. Raster Data
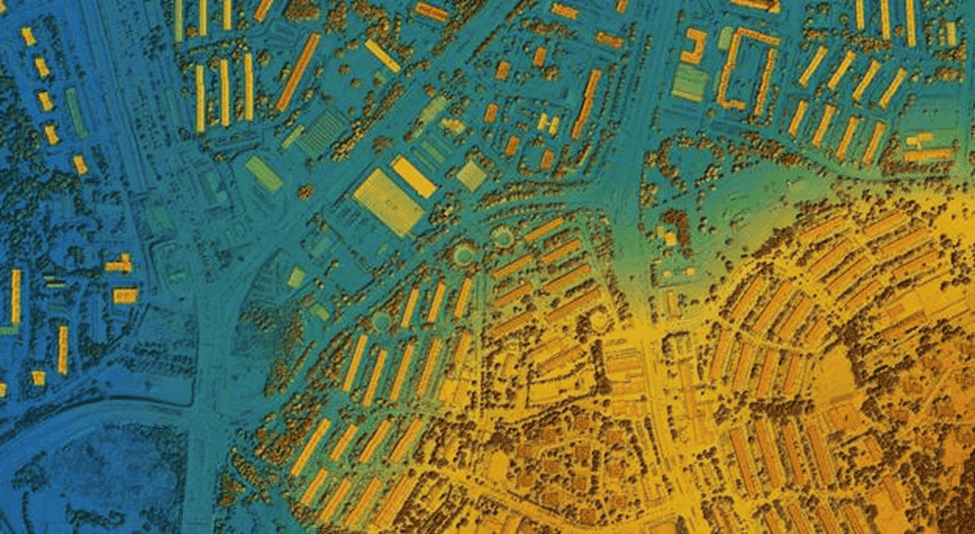
When geographical features are represented through a grid of cells or pixels, we call it raster data. Each cell in the grid has a value that corresponds to a specific attribute, such as temperature, elevation, or land cover. If your project involves representing a continuous phenomenon, raster data should be your ultimate choice.
Just like vector data, raster data too has its components, let’s have a quick peep at them.
Components of Raster Data
The first two components of raster data are cells and pixels, which are the smallest units of information in raster data. Both terms are often used interchangeably to describe raster data, including imagery. Each cell or pixel carries properties of dimension and value. It is important to note that the spatial resolution of raster data depends on the size of the cells; smaller cells provide higher resolution.
The third important component of raster data is band. Raster data usually have multiple bands and each of these bands represent different attribute or histogram of data. The perfect example is that of satellite imagery that includes multiple bands for different parts of the electromagnetic spectrum.
Advantages of Raster Data
The first advantage of raster data is that it is easy to produce as it represents the continuous phenomena (and it becomes its second advantage). From the first two features, emanates the third one: the grid-based structure of raster data simplifies data processing and analysis.
When it comes to conduct various types of spatial analysis – overlay analysis, distance calculation or surface analysis – raster data is the perfect fit and the preferred choice.
Optimize Your GIS Workflow with the Right Data Type
Make informed decisions with precise vector and detailed raster data solutions.
📞 Schedule a Call | 📩 Email Us | 💼 Get a Quote Now
Comparing Vector and Raster Data
| Features | Vector | Raster |
|---|---|---|
| Precision & Accuracy | Excels in precision and accuracy | Offers less precision due to its grid-based structure |
| Data Volume | More data-intensive | Data Efficient |
| Analytical Capabilities | Ideal for network analysis, topological modelling, and precise measurements | better suited for surface analysis, overlay operations, and modelling continuous phenomena |
| Visualization | Provides clear visualizations of geographic features | Excels in visualizing continuous data |
| Integration | Used together with raster to leverage the strengths of both data types | Used together with vector to leverage the strengths of both data types |
The answer to the question which data type you should use lies in your unique project needs. Here at GIS Navigator, we excel in producing both data types as our highly experienced team uses cutting-edge tools to provide results that surpass your expectations. Our GIS consultancy services have proven record of success as we have worked on projects of all sizes. To get your free quote, click here.