Geographic Information Systems (GIS) is a technology that enables the capture, storage, analysis and visualization of spatial and geographic data. It integrates several data types that include maps, satellite imagery as well as demographic information. This integration allows for analysing patterns, relationships and trends in a geographic context.
We must also mention that GIS is widely used in urban planning and development, transportation, environmental planning, etc. The obtained information based on spatial data enables informed decision-making in various sectors.
GIS is instrumental in helping us understand the world around us we live in. This technology also facilitates comprehending the interactions with the world by visualizing complex data. That happens through the analysis of a geographic framework.
In addition to that, GIS also enables effective mapping and analysis of natural and man-made systems alike. When professionals can understand certain patterns, they can predict outcomes promptly.
Moreover, complex problems can also be resolved by utilizing the dynamic visualization tools provided by GIS. As we have mentioned above, GIS enables efficient and effective planning in various fields. We must also add that GIS allows for effective resource management, enabling data-driven decision-making. All of this enhances how we interact with our world.
Want a More Accurate Digital Representation of Your Site?
GIS Navigator provides advanced modelling solutions to turn real-world data into actionable insights.
📞 Schedule a Call | 📩 Email Us | 💼 Get a Quote Now
Understanding GIS Modelling
Definition of GIS Modelling
The process of utilizing Geographic Information Systems (GIS) to simulate real-world scenarios, processes and phenomena is known as GIS modelling. This process is carried out by creating and analysing digital models that represent spatial data and relationships. This allows for predicting outcomes by analysing different scenarios and then making decisions based on geographic and spatial variables.
GIS data has many layers, and each layer represents a different type of geographic information such as terrain, buildings, and roads. In GIS modelling, these layers of data are brought together and processed to represent a specific area or phenomenon; involving both raster and vector data. The created models can either be static – representing a single point in time. Or they can be dynamic – projecting changes over time.
GIS modelling plays a vital role in several applications such as analysing spatial relationships, predicting trends and decision-making. In addition to that, GIS models also provide information to track the spread of a certain disease and take suitable actions accordingly.
Dynamic Systems in GIS
GIS offers dynamic systems in the form of models or simulations that are used to represent processes, phenomena, etc. that change with time. These dynamic systems offer in-depth analysis of temporal changes; allowing future predictions and also understanding the impact of several components based on spatial phenomena. Allow us to share that these dynamic systems not only capture spatial data evolution but also make them beneficial to study temporal processes.
By incorporating real-time data and algorithms, GIS models utilize current data to update the analyses several times. By doing so, the models become capable of reflecting up-to-the-minute conditions in a given system offering timely decisions based on accurate predictions. The incorporation of real-time data and algorithms also allows efficient resolution of complex problems. Ultimately, the obtained information helps in effective route optimization and resource allocation. All these offerings make GIS modelling indispensable for spatial data analysis as the users get to visualize, comprehend and also predict patterns, trends and relationships in the available geographic information.
How GIS Converts Real-World Data into Digital Models
The process of data collection and integration in GIS is systematic. Let’s look at how that works:
1. Data Collection and Integration
GIS utilizes various sources to collect real-world data. These sources include:
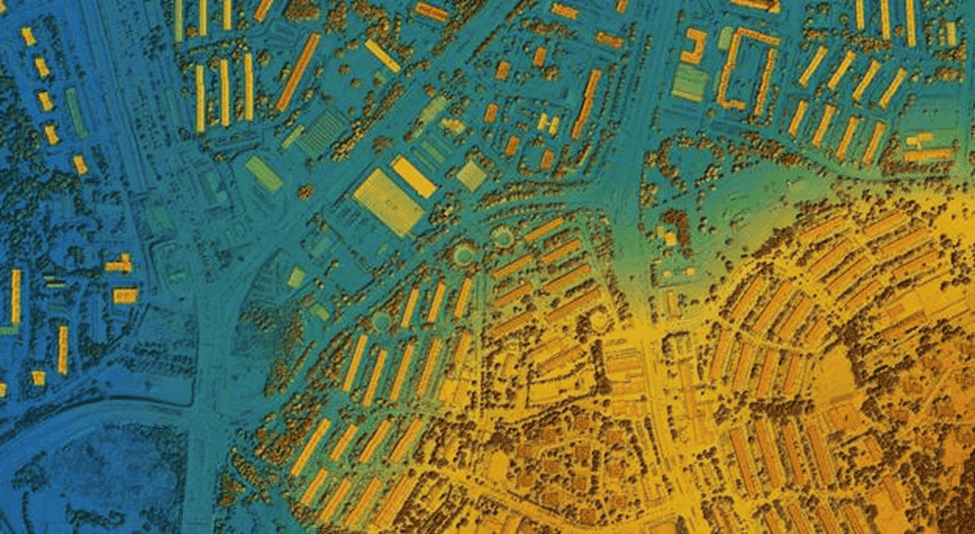
Remote Sensing: This process of data collection uses satellite imagery, aerial photography and LiDAR scans.
Ground Surveys: This process of data collection is carried out directly from the field. It gets done through GPS data, field surveys and manual measurements.
Sensor Networks: These networks use a system of interconnected devices that collect and transmit data in real time. Weather stations, traffic sensors and environmental monitors are used to collect data on atmospheric conditions, traffic flow and environmental parameters respectively.
Historical Records: This type of data refers to the information that was gathered in the past in the form of archives, maps and other demographic data. All the data provides valuable information for understanding historical trends and predicting future scenarios.
Data Standardization and Formatting
The extensive process of data standardization and formatting offers organized data to be efficiently used in GIS. Since the data is quite diverse, the said process makes it compatible with other available systems and models.
Georeferencing allows professionals to align the data with geographic coordinates. By doing so, they can place the data on a map accurately. This also allows precise analysis and visualization of data.
Data Conversion allows converting data from one format to another to be used in GIS. Through the process of data conversion, professionals can ensure that different types of data can be studied together in GIS without facing compatibility issues.
Data Pre processing, the name suggests, involves correcting errors and removing inconsistencies from the data. And if there are any gaps within the data, those can be filled too. This process enables accurate use of data for personal and commercial projects.
2. Data Processing and Analysis
The process of transforming raw (real-world) data into usable digital models is done within GIS through date collection, data processing and data analysis. These models represent the spatial features and patterns.
Spatial Analysis Techniques
Overlay Analysis: This spatial analysis technique involves the process of combining data layers to identify patterns or relationships. This technique allows the users to understand how different spatial factors interact in a given area.
Buffering and Proximity Analysis: The buffering technique creates a buffer around a specific feature. Then the proximity analysis determines how close or far other features are from a specific buffer zone.
Interpolation: It is the process of estimating unknown values within datasets based on known values. Interpolation plays a vital role in creating continuous surfaces such as elevation models.
Data Transformation and Enhancement
Geocoding: This technique involves the process of converting addresses into geographic coordinates. A business can visualize where its potential customers are located geographically by geocoding their addresses.
Statistical Analysis: By using this technique, the users can apply statistical methods to uncover trends, patterns or relationships. Spatial analysis helps GIS used to find hidden information with their spatial data e.g., How attribute values are spread out, do we have any patterns in data.
3D Modelling and Simulation
3D Terrain Modelling: This process involves the creation of digital elevation models (DEMs). DEMs are digital representations of the Earth’s surface and allow visualization and analysis of terrain features.
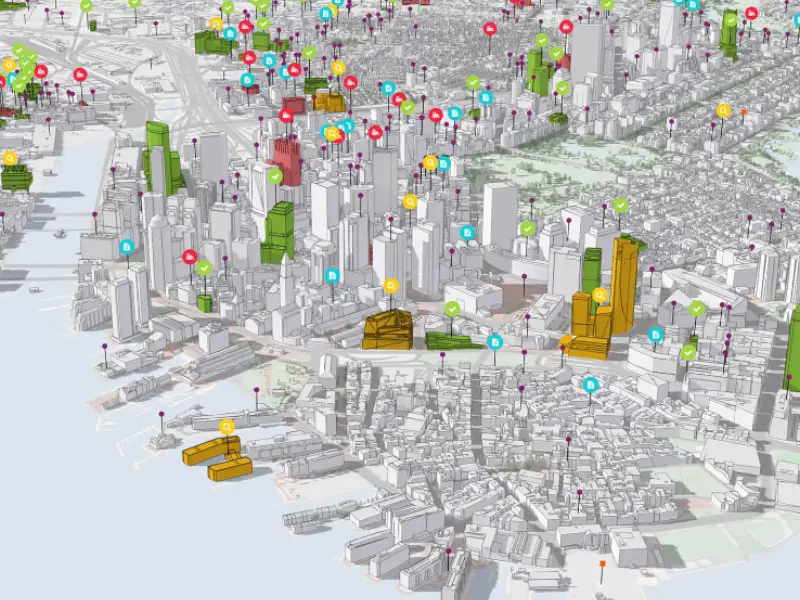
Building and Infrastructure Modelling: This process involves the process of developing detailed 3D models of buildings and infrastructure. These models are used to represent the physical characteristics of structures which help in realistic visualization.
Scenario Simulation: This process allows the users to simulate events and predict outcomes using 3D models. Scenario simulation is crucial when it comes to assessing risks and disaster management.
Looking to Enhance Your Project with GIS Digital Modelling?
Make informed decisions with precise, data-driven 3D models. Speak with our experts now!
📞 Schedule a Call | 📩 Email Us | 💼 Get a Quote Now
3. Model Creation and Visualization
Layered Mapping and Visualization
Thematic Mapping: This technique involves highlighting specific themes using data layers. Thematic mapping enables the highlighting of specific aspects of an area.
Heat Mapping: It involves visualizing data density using colour gradients. Heat maps are crucial to represent areas with higher concentrations of data such as disease outbreaks, crime rates, etc.
Time-Series Visualization: This process involves animating data to show changes over time. The process is particularly great for tracking various trends such as urban growth.
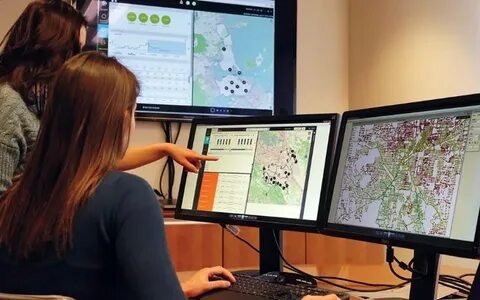
Interactive GIS Tools
Web-Based GIS: These tools refer to web-based platforms that allow online interaction with GIS data and models. Web-based GIS tools make it easier for users to carry out the required GIS-related tasks without being dependent on any specialized software. These tools are widely used for urban planning and development, environmental monitoring, etc.
Custom GIS Applications: These are specialized tools for specific needs and are utilized to cater to specific needs. Custom GIS applications are usually created to aid in specific circumstances such as wildlife monitoring, disaster management and more.
Augmented and Virtual Reality: Augmented and Virtual Reality play a crucial role in GIS applications as they offer immersive experiences. Such tools enable users to interact with data in such a way that it becomes more intuitive – allowing informed decision-making.
Real-Time Data Integration
Live Data Feeds: These data feeds refer to the incorporation of real-time data into GIS models. Such feeds play a vital role in representing traffic flows, weather conditions, etc. GIS becomes much more efficient when real-time data integration takes place.
Dynamic Modelling: In the process of dynamic modelling, the GIS models update continuously. It is instrumental in the context of GIS as it allows the models to only reflect data that is most current; allowing accurate analysis and data-driven decision-making.
Automated Alerts: Another useful aspect of real-time data integration is that it triggers alerts based on data conditions. After receiving automated alerts, the decision-makers find themselves in a better position to quickly respond to emergencies.
4. Decision-Making and Problem Solving
Scenario Planning and Impact Analysis
What-If Scenarios: This technique is instrumental in exploring potential outcomes by adjusting model variables in GIS. By utilizing What-If scenarios, the users can understand the potential effects of a certain action; ultimately helping in making informed decisions.
Risk Assessment: As the name suggests, this technique helps in evaluating risks using GIS models. GIS also allows for assessing risks and making timely decisions accordingly.
Stakeholder Collaboration
Shared GIS Platforms: This term means that multiple stakeholders can access the data for GIS model. It enables transparency and facilitates coordinated decision-making.
Volunteered GIS: It allows for involving the public in decision-making by utilizing GIS tools. By allowing the public to participate in such decision-making, by giving them access about scenarios so they can give their input, and authorities can take decisions accordingly.
Reporting and Communication: This process involves using GIS visuals to communicate complex information in accessible ways. Translating data into visual formats enables stakeholders to understand and visualize scenarios and take desired actions.
5. Continuous Improvement and Adaptation
It refers to the process of refining and updating GIS systems and data to meet evolving needs in given situation or time. Let’s explore how that happens!
Feedback Loops and Model Refinement
Validation and Calibration allow for refining models’ accuracy by comparing the predictions with actual outcomes. User Feedback Integration refers to the process of adapting models based on user feedback. And Technology Upgrades offers enhancing models with the latest advancements. This enables improving the performance of the models.
Scalability and Flexibility
Scalable Models expand or reduce model scope if and when needed. As far as the Adaptable Frameworks are concerned, they allow for incorporating new data and technologies. This ensures that the models remain relevant to the evolving needs & challenges.
Applications of GIS Modelling
There are various applications of GIS in multiple sectors and fields. Let’s go through a couple of them in this part of the article:
Urban Planning
GIS is crucial for urban planning and development. For example; by utilizing spatial analysis and visualizing the data, planners get access to land use, environmental impact and more. The obtained information helps in the optimization of various processes such as infrastructure development. This promotes sustainable growth and creates a harmonious environment for the masses to live in. Moreover, GIS also allows for effective resource management – resulting in making resilient infrastructures.
Environmental Management
As far as the environmental management is concerned, GIS enables professionals to carefully monitor the environmental changes. In addition, it also enables effective mapping of natural resources, all the while facilitating disaster management. Another use of GIS in environmental management is that it helps assess the impacts of projects. The obtained data then aids in planning for sustainable initiatives and more.
Disaster Response
GIS modelling helps identify high-risk areas and offers effective evacuation planning. Such information is also helpful during natural calamities. Professionals can work on optimal evacuation routes and mitigate the risks of infrastructure damage, human casualties, etc.
Transform Raw Data into Smart Decisions!
Our GIS modelling solutions help you visualize, analyse, and plan with confidence. Let’s discuss your needs!
📞 Schedule a Call | 📩 Email Us | 💼 Get a Quote Now
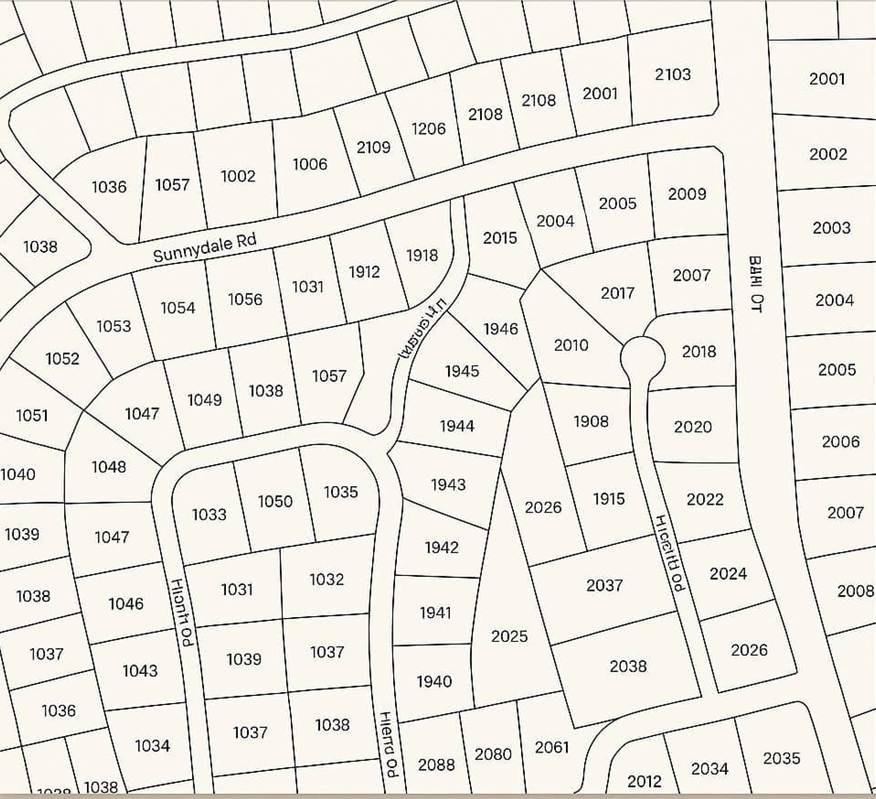
Real Estate
By allowing the analysis of spatial relationships, GIS modelling offers effective trend predictions in the market. Moreover, it also helps in a careful assessment of the properties and their values. Such data enables the investors to identify opportunities that can be utilized for industrial, commercial and residential structures.
Get in touch with GIS Navigator today and our team of experts will help you out in your next project!